In this blog I demonstrated how one can programmatically explore several chaotic systems: logistic map, Barnsley fern and Lorenz system. While doing this I focused mainly on producing plots or, at least, generating trajectories of these systems with different programming languages. At the same time, on my personal web page I have a section fully devoted to this same topic, where one can plot trajectories of simple chaotic systems right in their browser. Until recently I had only 1- and 2-dimensional systems, but last week I added the Rössler attractor and in this post I am going to show how one can easily produce 3-dimensional plots using only HTML5 canvas and a very handy three.js library.
Creating 3D images in the browser is quite different from plotting something in 2D – since HTML5 we have the canvas element, which allows one to draw whatever they want on a plane. On the other side, in case 3 spatial coordinates are required there are several alternatives, which might look less friendly. The first thing that comes to mind is WebGL, although there are problems with it – most notably, this technology is not supported by some browsers. Since we are dealing with quite a simple issue – we need neither complex coordinate transformations nor shaders for making graphs glamorous – imposing WebGL’s strict constraints on clients is a bit of an overkill. Another option is to implement the mechanism of transforming 3D coordinates of the model into 2D canvas coordinates ourselves. Even though I love to build something that was created by others long before, implementing a part of WebGL myself with a purpose of merely producing some plots is not a good idea as well. Fortunately, there is the third option – that is to use a Javascript library which helps to render 3-dimensional objects in the traditional canvas element. Three.js is a library of exactly this kind. To be more precise, it includes quite a few renderers allowing to use different lower level technologies to produce images in the browser, but we will try the CanvasRenderer only.
Let’s say a couple words about what we are actually going to render. Rössler attractor is another chaotic system of three differential equations. The same way as with Lorenz attractor we will bring the attractor to the discrete space by means of finite difference method. What makes me want to plot the trajectories of the Rössler system is their interesting form. If we take a long enough trajectory it will look like a closed tape in the XY-plane with one section of it leaving the plane to rise to much higher values of Z-coordinate and then returning to the original plane. An interesting detail is that with some values of parameters the trajectory looks like a more or less simple tape, but with other values it gets somewhat reminiscent of the Möebius strip due to strange bents in its structure. To see this we need to actually produce the plots, so let us stop talking and get to programming.
At the first stage we can leave the chaotic systems aside and set up the routines required to produce 3-dimensional lines on the canvas. For me this exercise was particularly interesting because creating a plotter is a good use-case to try some object-oriented Javascript. Our Plotter3d object will encapsulate the details of talking to three.js library required to produce graphs and here it is the constructor:
function Plotter3d(canvasElement) {
    this._scene = new THREE.Scene();

    var w = canvasElement.width * 0.1;
    var h = canvasElement.height * 0.1;
    this._camera = new THREE.OrthographicCamera(
        -w/2, w/2, h/2, -h/2, -100.01, 5000);
    this._camera.position.z = 20.0;

    this._renderer = new THREE.CanvasRenderer({ canvas : canvasElement });
    this._renderer.setSize(canvasElement.width, canvasElement.height);

    this._plots = [];
};
The code above sets up the scene, camera and renderer, which are the basic objects responsible for creating the image on the screen. The scene in our case serves as a simple container for the rendered objects. Three.js actually makes our life so simple that to create a fully functional scene we don’t do any tuning and need only to instantiate the object. The process of setting up a camera is a bit trickier. First of all, there are two key types of camera available in three.js: PerspectiveCamera and OrthographicCamera. Since we are plotting trajectories of a mathematical system and not a real 3D scene, we can hardly make any use of perspective – thus, the OrthographicCamera is our choice. To set it up we need to specify 6 numbers: 4 for the left, right, top and bottom boundaries of its viewport and 2 for the positions of the near and far clip planes. Since we use a canvas as a rendering target, the bounds of the viewport are most naturally determined with its width and height. As for the positions of clipping planes, we just need to specify the figures, which will allow us to see the entire trajectories – that is no single section of a trajectory should fall behind the planes. (In addition to basic instantiation of the camera, I also move it along the Z-axis – with the orthographic projection this does not change anything, but this is kind of legacy from my first attempts with PerspectiveCamera.) If you want more details on the orthographic camera check out this Udacity video lesson and three.js documentation. Finally, we have to create a renderer passing it the canvas element and setting its size based on the size of the latter. One last step is to add a member variable to store the trajectories, which are displayed by the plotter so that we can alter them if needed – _plots array will be responsible for that. After these preparation steps we can actually add some objects to the scene.
function ptsToGeometry(points) {
    var g = new THREE.Geometry();

    for(i = 0; i < points.length; ++i) {
        p = points[i];
        v = new THREE.Vector3( p[0], p[1], p[2] );
        g.vertices.push(v);
    }
    return g;
}

function createLine(points) {
    var g = ptsToGeometry(points);
    var m = new THREE.LineBasicMaterial( { color : 0xff0000 } );
    var line = new THREE.Line(g, m);
    return line;
}

Plotter3d.prototype.addPlot = function(points,color) {
    var l = createLine(points,color);

    this._plots.push(l);
    this._scene.add(l);

    this._renderer.render(this._scene,this._camera);
};
First, we want plotter to take a sequence of 3-dimensional points and display a connected line. This means that the addPlot method should take one argument – an array of arrays. Internally though the things are slightly more complicated. To make our points renderable we have to transform them to the form, which three.js will understand. To represent a set of vertices the library uses the notion of Geometry, which holds a collection of 3D vectors – points. It may also contain additional stuff like normals and other useful things, but we don’t need them now. This said, we transform each of our points from a simple array to a Vector3 object and add the latter to a new instance of Geometry object – that’s what ptsToGeometry function is responsible for. However, this is only a part of the story because to render something three.js needs not only vertices but also some idea about the way they are connected to each other.
In our case, this information is communicated by means of the Line. By default three.js treats Line objects as those representing a line strip – a mere sequence of line segments connecting the vertices from the first to the last one. Beside the information on how to treat the underlying geometry, Line also holds a material instance, which informs the renderer on some visual aspects of our line. We will use the LineBasicMaterial created with a single parameter – color. Actually, materials are more powerful than just something storing color information, but for the purpose of plotting graphs being able to set line colors is just enough. Now, the createLinefunction does the following things: calls ptsToGeometry to transform an array of arrays into an instance of Geometry, sets up a simple material and constructs the Line object, which combines the two. This function is called from the Plotter3d.addPlot method that stores the resulting Line in the plotter’s collection of graphs, adds it to the scene and asks renderer to update the scene – it’s that simple. Next thing to do is to create a trajectory of the Rössler system.
function nextRossler(p,a,b,c,dt) {
    var x = p[0];
    var y = p[1];
    var z = p[2];

    var nx = x - dt * (y + z);
    var ny = y + dt * (x + a*y);
    var nz = z + dt * (b + z * (x - c));

    return [nx,ny,nz];
}

function rosslerGenerator(a,b,c,dt) {
    var r = function(p) {
        return nextRossler(p,a,b,c,dt);
    };
    return r;
}

function trajectory(g,n,p0) {
    var ps = [p0];
    for(i = 0; i < n; ++i) {
        ps.push(g(ps[i]));
    }
    return ps;
}
The nextRossler function above generates a point on the trajectory using the same method of finite differences that I described in the post about Lorenz system. Because it actually represents the Rössler system approximation we have to feed it three parameters of the system (a, b and c) and the dt discretization parameter. Moreover, to obtain some point we have to provide our function the preceding one. To avoid the need to manually handle all these arguments on each step of the trajectory we have another routine – rosslerGenerator, which takes the parameters once and returns a function wrapping the nextRossler with these arguments. Finally, we use the trajectory function to produce a sequence of points from a single starting point. Its first parameter is supposed to be a function returned by rosslerGenerator and the second one is the origin of the trajectory. Now we are only one step away from seeing some chaos in the browser – the only thing that we lack is the HTML page.
<!DOCTYPE html>
<html>
<head>

<link rel="stylesheet" type="text/css" href="style.css">

<script src="three.min.js"></script>
<script src="jquery-1.10.2.min.js"></script>
<script src="rossler.js"></script>
<script src="Plotter3d.js"></script>
<script>

    plotter = null;

    $(document).ready(function() {
        plotter = new Plotter3d($('#plotter')[0]);
    });

    function addPlot() {
        var r = rosslerGenerator(
            getp("#a"),getp("#b"),getp("#c"),getp("#dt"));
        var ps = trajectory(
            r,getp("#l"),[getp("#x0"),getp("#y0"),getp("#z0")]);
        plotter.addPlot(ps);
    }

    function getp(n) {
        return parseFloat($(n).val());
    }

</script>
</head>

    <body>

        <canvas id="plotter" width="600" height="400">
        </canvas>

        <div>
            <input type="text" id="a" value="0.2" />
            <input type="text" id="b" value="0.2" />
            <input type="text" id="c" value="5.7" />
            <br />
            <input type="text" id="x0" value="-10.0" />
            <input type="text" id="y0" value="0.0" />
            <input type="text" id="z0" value="0.0" />
            <br />
            <input type="text" id="l" value="1000"/>
            <input type="text" id="dt" value="0.05"/>
            <button onclick='addPlot();' >Go!</button>
            <br />
        </div>
    </body>
</html>
The HTML is fairly simple – we only have a canvas and a number of inputs for Rössler system parameters and initial conditions. To collect the values from these inputs I use a trivial getp function, which basically wraps the jQuery selector and parses the input’s value into a floating point number. Another important component is the addPlot function that handles clicks on the Plot button. Its purpose is to collect the parameters, create a proper Rössler system model, use it to produce a trajectory and finally ask the Plotter3d instance to render it. The only thing that I didn’t cover yet is creation of the plotter. I do it right after the page is loaded so that the canvas element can be passed to its constructor. Here it is: the plot of the Rössler attractor in the browser!
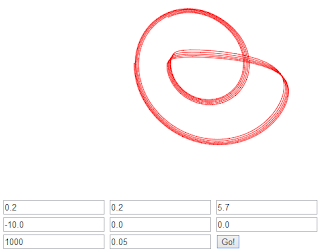
Wait, didn’t we miss something? Right at the beginning of this post I promised that we will plot the Rössler trajectory in 3D, while what we see now doesn’t really look like a 3-dimensional plot. The problem, though, is easily identified: we just look on our plot from top to bottom and in this case we can’t see anything else than the projection of the trajectory on the XY plane. Let’s go back to the Plotter3d constructor and rotate our camera a bit.
function Plotter3d(canvasElement) {
this._camera = new THREE.OrthographicCamera(
-w/2, w/2, h/2, -h/2, -100.01, 5000);
this._camera.rotation.x = 3.14 / 3;
};
If we try to plot something without further changes we’ll notice that the trajectory, which does look like 3-dimensional plot thanks to the rotation, now fails to fit into the viewport. To make the picture more appealing we can add some scaling to the camera.
function Plotter3d(canvasElement) {
var scaleFactor = 1.3;
this._camera.scale.x = scaleFactor;
this._camera.scale.y = scaleFactor;
this._camera.scale.z = scaleFactor;
this._camera.position.z = 20.0;
};
There is no special magic to the 1.3 thing above – I just guessed it picking some initial number and then trying to adjust it so that the plot looks the way I want it to. However, in real applications we would have to do something more intelligent and adaptive. Usually one can derive the desired parameters from the relations between the size of the canvas (more generally – viewport) and the dimensions of different objects in the scene, although for the purpose of this example the result obtained through a number of intelligent guesses is good enough.

For me the picture above is a great achievement by itself, but let’s go further and animate it, so that it looks more vivid and presents us the Rössler system’s trajectory in finer detail – we will make the plot slowly rotate around the Z-axis. To do this we have to provide three.js a routine that will be responsible for modifying the scene for each animation frame. I define it as another method of the Plotter3d object. Additionally, we will call this function in the plotter constructor to start animating the scene.
Plotter3d.prototype.animate = function() {
requestAnimationFrame(this.animate.bind(this));
this._camera.rotation.z += 0.01;
this._renderer.render(this._scene,this._camera);
}
function Plotter3d(canvasElement) {
this._plots = [];
this.animate();
};
The animatefunction is very simple and does only three things. First, it asks three.js to call it when time comes to do the next animation step. After that, it increases the camera’s rotation angle around the Z-axis by a little number so that on each successive frame the scene appears rotated a bit more. Finally, animate renders the current frame and that’s the moment when we see the changes on the screen. However, if we try to launch the program now, we’ll see that the plot’s rotation doesn’t look that nice – the problem is that the most reasonable axis to rotate the plot around is the vertical one. At the same time the camera’s Z axis points into the screen, so the plot rotates in the latter’s plane. To fix this we might try to change the animate method so that it rotates camera around the Y-axis instead of Z, although this won’t bring us to the result we want. So how do we tackle this problem? Well, thanks to storing the plotted trajectories in our object the task is relatively easy.
Plotter3d.prototype.animate = function() {
requestAnimationFrame(this.animate.bind(this));
for(i = 0; i < this._plots.length; i++) {
this._plotRotationZ += 0.01;
this._plots[i].rotation.z = this._plotRotationZ;
}
this._renderer.render(this._scene,this._camera);
}
function Plotter3d(canvasElement) {
this._plots = [];
this._plotRotationZ = 0.0;
this.animate();
};
The idea is that instead of rotating the camera, who’s position and orientation we have already changed, we can rotate the plots. Because we neither moved them nor rotated around any axis, the plots' own Z axis still points from their XY plane (where most of the Rössler trajectory lies) to the top. That said, we only have to replace the camera.rotation.z += 0.01 line in the animate function with a loop that will run through the list of plots and set the desired rotation for each of them. A little complication required here is to add a member variable that will store the current rotation angle – _plotRotationZ. If we miss this and simply increase the rotation angle of plots on each animation step they won’t be synchronized, i.e. the plot which was created earlier will appear with different angle than the one created later. Although sometimes this might be what one wants, for now I’d better try to preserve at least some measure of mathematical accuracy, leaving the experiment with independent angles to you.
So now we can launch the created page in a browser and spawn a number of nicely rotating trajectories of the Rössler system there. To make the thing better and more interesting to play with one can introduce lots of different improvements. The first to come to my mind are to color different trajectories differently to make them distinguishable and to grant user more control of the image: for example to give them the ability to scale and rotate the plots the way they want. I have partially implemented both these minor features on my site – feel free to go there and look through the source code. However, beware of possible inefficiency and dirt – I didn’t put enough effort into improving my implementation of the plotter and removing obsolete parts.
As for moving further with three.js, there are dozens of ways to go. If one really wants to make up a nice browser-based 3D plotter the good place to start is to introduce coordinate grid and give explorers more options to control and tune the graphs. Good plotting applications should also include such things as legends, export capabilities and more. On the other side, those interested in 3D graphics would likely want to see some beautiful 3D scenes in their browser and could begin with spawning some solid primitives like cubes, spheres and pyramids, texturing them and playing with camera settings – maybe even swapping the orthographic one with the PerspectiveCamera. Whatever you chose there are dozens of impressing examples on the three.js website ranging from quite simple things to absolutely amazing 3D applications. Graphics always seemed to me one of the most fascinating and emotionally rewarding programming applications, no matter are you a beginner or a mature programmer. So go and grab some reward!
As usual, the code of our plotter is available at github. Feel free to get it and play to your pleasure. I will also appreciate feedback in any form: advice, suggestions, questions and even mere muttering!
I am a full-time .NET programmer and a lover of C#, C++, Clojure and Python at the same time. I do some Windows Phone development on my own and occasionally try myself at web-development. To enhance all these software-related activities I maintain a blog writing there on various topics, most of which actually come back to programming.


