Introduction
Several years ago, I used a sample code of VB 6.0 project, Fast graphs without an ActiveX / OCX control by Felix Haas. There he proposed a relatively simple but effective way to construct Cartesian coordinates with grid lines using GDI.
I used this code as a template for my own project in VB 6.0 when I needed to draw line charts based on manually input values, on data queried from database or on real time data. Things changed dramatically for Graphics related code after the introduction of VB.NET and GDI+.
The sample code is an adaptation of initial VB 6.0 code to GDI+ classes and upgrade to VB 2010.
Background
Windows GDI/GDI+ uses a mirrored first quadrant of Cartesian coordinates with origin (0,0) in the upper-left corner instead of bottom-left origin in Cartesian model. The reason that Windows coordinates are drawn this way comes from the initial GDI mapping modes (the attribute of the device context that governs how logical coordinates are translated into device coordinates).
From Programming Windows with MFC by Jeff Prosise, O Reilly, 1999, chapter The Windows GDI:
In GDI when you draw in the MM_TEXT mapping mode, you're using the coordinate system where the origin is in the upper left corner of the window, the positive x axis points to the right, the positive y axis points downward, and 1 unit equals 1 pixel. You switch to one of the "metric" mapping modes- MM_LOENGLISH, MM_HIENGLISH, MM_LOMETRIC, MM_HIMETRIC, or MM_TWIPS - the y-axis flips so that positive y points upward and logical units are scaled to represent real distances rather than raw pixel counts.
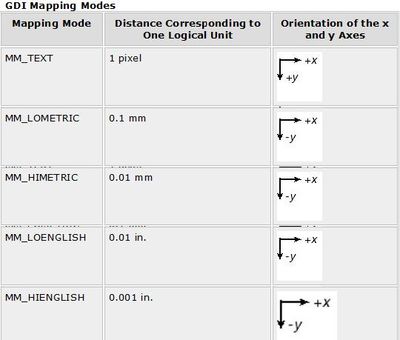
Text we draw on the screen down from the upper-left corner with number of lines increasing.
And the default GDI mapping mode is MM_TEXT which is a bit confusing for image drawing.
In Visual Studio, C++ and GDI, you could apply metric mapping modes or user-defined mapping modes to get charting capabilities.
In VB 6.0 and GDI, you could use methods Scale, Line and properties AutoRedraw, CurrentX, CurrentY to construct the coordinates and draw the chart.
In VB.NET and GDI+, you have to use Transforms (Translate, Scale, etc.) to get similar results.
Using the Code
The project consists of two modules frmChart.vb (main form with drawing procedure) and modSettings.vb (initial settings for the chart, conversion functions and public variables). In Visual Basic 6, the default graphics units were twips (thus the initial project was based on them).
In VB.NET, they are replaced by pixels, and for upgrade we use points units available in VB.NET because it was easier to recalculate. To redraw the graphics objects when form is repainted (that was done with AutoRedraw in VB 6.0), the Form.Paint event is used.
In VB 6.0, we could use Scale method to mirror the second Quadrant and to set the origin in the bottom-left corner. In VB.NET, this graphics method was removed and we have to use Transforms to obtain similar charting capabilities.
From MSDN Transforms Overview:
Transform defines how to map, or transform, points from one coordinate space to another coordinate space.
This mapping is described by a transformation Matrix, which is a collection of three rows with three columns of Double values.
Here is the corresponding code:
Dim graphicsObj As Graphics = eventArg.Graphics
Dim chartMatrix As New Drawing2D.Matrix()
graphicsObj.Transform = chartMatrix
Notice that we just defined the graphics object in this code without transforms for labels (numbers in this case) to be drawn correctly.
For I = Xmin To Xmax
graphicsObj.DrawString(Trim(Str(I)), drawFont, drawBrush, _
XinPoints(I) - 2 * Len(Trim(Str(I))), YinPoints(0) + 100)
Next
For I = Ymin To Ymax
graphicsObj.DrawString(Trim(Str(-scaleFactorY * I + Ymax + Ymin)), _
drawFont, drawBrush, XinPoints(scaleFactorX) - 10 - _
2 * Len(Trim(Str(scaleFactorY * I))), YinPoints(scaleFactorY * I) - 12)
Next
Now we can apply Transforms to the graphics object:
graphicsObj.TranslateTransform(0.0F, PictureHeight + 20)
graphicsObj.ScaleTransform(1, -1)
Now, we construct the coordinates with grid lines using graphicsObj.DrawLine method (here is only for X-axis).
graphicsObj.DrawLine(blackPen, XinPoints(Xmin) - 100, _
YinPoints(0), XinPoints(Xmax) + 5, YinPoints(0))
graphicsObj.DrawLine(blackPen, XinPoints(Xmax) + 5, _
YinPoints(0), XinPoints(Xmax), YinPoints(0) - 5)
graphicsObj.DrawLine(blackPen, XinPoints(Xmax) + 5, _
YinPoints(0), XinPoints(Xmax), YinPoints(0) + 5)
For I = Xmin To Xmax
blackPen.DashStyle = Drawing2D.DashStyle.Dash
If I <> 0 Then
graphicsObj.DrawLine(blackPen, XinPoints(I), _
YinPoints(Ymin), XinPoints(I), YinPoints(Ymax))
End If
Next
And finally – draw the test lines on the coordinates.
x = 0
y = 0
graphicsObj.DrawLine(bluePen, XinPoints(1), YinPoints(6), _
XinPoints((Xmax - Xmin) / 20 * x + Xmin), YinPoints(y))
x = 1
y = 6
graphicsObj.DrawLine(bluePen, XinPoints(2), YinPoints(4), _
XinPoints((Xmax - Xmin) / 20 * x + Xmin), YinPoints(y))
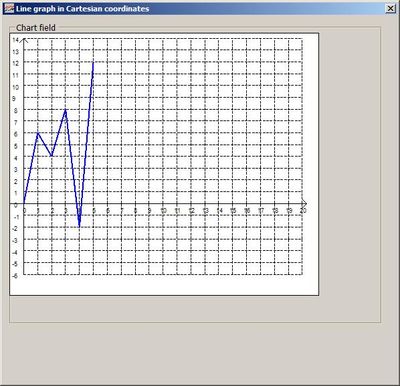
This is only a simple chart drawn in Cartesian coordinates. If you want to draw a graph of real time data or data queried from database, you would have to solve much harder tasks.
References
History
- 08.2007 - Built in Visual Basic 6.0
- 04.2011 - Upgraded to Visual Basic 2010
This member has not yet provided a Biography. Assume it's interesting and varied, and probably something to do with programming.


 General
  News
News  Suggestion
  Question
  Bug
Bug  Answer
  Joke
Joke  Praise
  Rant
Rant  Admin
Admin 


