Click here to Skip to main content
15,883,896 members
Articles / Programming Languages / Javascript

JavaScript Chart

Rate me:
Please Sign up or sign in to vote.
4.64/5 (10 votes)
2 May 2007CPOL3 min read 114.7K   2.2K   51   13
Add a stylish chart to your Web page using only client-side JavaScript.
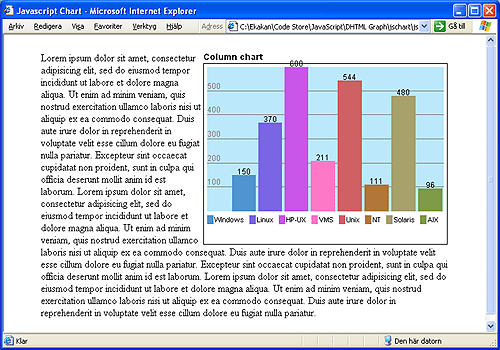
Screenshot - jschart.gif

Introduction

Wouldn't it be nice to be able to add a stylish and colorful chart to your Web page with minimal effort and still avoid slow-loading Java applets or server side generated images? Then the JavaScript Chart is just what you need!

The JavaScript Chart supports:

  • Several charts on the same page
  • No limit on the number of data items in one chart (as long as you have enough space)
  • Pass the chart data as a string in the following format: Item A;1;Item B;2;Item C;3.
  • Gridlines are automatically created and spaced with appropriate increments depending on the highest value in the data range
  • Choose if item values should be displayed or not on each individual chart
  • Choose if the chart legend should be displayed or not
  • Each data item will automatically get a different matching color
  • Each chart can be rendered in debug mode, showing some useful information if the chart is not displayed as expected
  • Modification of some of the layout parameters with CSS

This small utility will simply take a semi-colon delimited data string (the delimiter can be changed) and generate a chart for you. You can add several charts to the same page and there is no limit to how many data items you can have in one chart, just as long as you have enough space in your page.

This code is by no means perfect and I'm sure there is lots of room for improvements, but hopefully you will find it useful.

Background

I was searching around to find a client-side JavaScript chart without much success, so I decided to write my own. Then, when coming here to The Code Project to upload my solution, I stumbled across the excellent article "Cool Graph Object to Plot Column and Line Graphs in your Web Pages." by Wagner DosAnjos. Ah, well... Even though the functionality is very similar, I guess there are also some differences, so I'll post my solution here anyway.

Using the Code

Include the JavaScript file in your Web page HEAD section:

HTML
<script language="javascript" type="text/javascript" src="jschart.js"></script>

Create a DIV element in your Web page and give it an ID attribute. This will be the container for your chart.

If you do not specify any width or height attributes, the following default values will be used: Width: 100%, Height: 300px. You can override those default values with your DIV element and you can also position the element if you'd like.

HTML
<div id="myChart" style="width:60%;"></div>

Now we need to create the actual chart object and assign it to the container. In the sample, I created a small function that is called from the onLoad-event.

Imagine that the chart data string is generated from a database SQL query, a Web Service, an Ajax call to some datasource, or whatever you decide.

JavaScript
<script language="javascript" type="text/javascript">
    
    // This is the chart data as a semi-colon delimited string.
    var chartData = 
        "Windows;150;Linux;370;HP-UX;600;VMS;211;Unix;544;NT;111;Solaris;480;AIX;96";

    function initCharts() { 
        var chart = Chart;
        // Initialize the chart with the id of the container DIV element.
        chart.init("myChart"); 
        chart.title = "Column chart" // Set the chart title.
        chart.type = "column"; // Specify the type of chart - "column" or "bar".
        chart.debug = false; // Debug. False if omitted.
        chart.showLegend = true; // Legend. True if omitted.
        chart.showValues = true; // Data item value labels. True if omitted.
        chart.setData(chartData); // Set the chart data.
        chart.render();
    }
</script>

Now add the function to the BODY onLoad-event.

JavaScript
<body onload="initChart()">

Refer to the file jschart_demo.html (available for download with this article) for a complete sample.

History

  • 1.1, 2007-May-01: Handle errors for incorrect data and more debug information
  • 1.0, 2007-Apr-01: Article created

License

This article, along with any associated source code and files, is licensed under The Code Project Open License (CPOL)


Written By
Web Developer Know IT Stockholm
Europe Europe
Software developer @Know IT Stockholm:
Java/JEE/JMS/JSF
JavaScript

Comments and Discussions

 
QuestionGreat Chart Pin
Julian Michael7-Nov-14 21:40
Julian Michael7-Nov-14 21:40 
GeneralMy vote of 5 Pin
Reza Samadabadi10-Jul-11 20:46
Reza Samadabadi10-Jul-11 20:46 
GeneralMy vote of 5 Pin
Vixanna27-Oct-10 11:51
Vixanna27-Oct-10 11:51 
GeneralLine chart Pin
Clayton Bonelli3-Sep-09 2:34
Clayton Bonelli3-Sep-09 2:34 
GeneralRe: Line chart Pin
Magnus Lundahl3-Sep-09 9:17
Magnus Lundahl3-Sep-09 9:17 
Generalvery good Pin
Dai Jingjing24-Nov-08 0:34
Dai Jingjing24-Nov-08 0:34 
very good & sample chart, Wink | ;)

i added percent show.(default show)

chart.showPercent = false; //disable

<pre>
/**
* Javascript Chart.
* Draws a chart based on structured data. Light-weight and simple to use.
* Supports any number of items in either a column or bar style chart.
* Value-labels, legend and debug info can be switched on or off.
* Defaults to showing both legend and values.
* Use it as you see fit.
*
* Usage:
* var chart1 = Chart;
* chart1.init("chart1"); // Pass the element id of the chart container.
* chart1.title = "Bar chart";
* chart1.type = "column"; // Set either "column" or "bar".
* chart1.debug = true;
* chart1.showLegend = true;
* chart1.showValues = false;
* chart1.setData("A;1;B;2;C;3"); // Pass the data to the chart as a semi-colon delimited string.
* chart1.render();
*
* Author: Magnus Lundahl, Ekakan Systems AB. magnus.efferus@gmail.com
* Version: 1.1
* Revision history:
* 1.1, 2007-may-01. Handle errors for incorrect data and more debug info.
* 1.0, 2007-apr-01. Created.
*/
var Chart = {

/**
* The graph object. Short-hand for "this". Set in the init-method.
*/
o : null,

/**
* The graph's container element. Passed as a string argument to the init-method.
*/
container : null,

/**
*
*/
title : "",

/**
* The chart type, bars or columns.
*/
type : null,

/**
* The graph data as an array.
*/
data : null,

/**
* The delimiter used for separating the data string passed
* to the method setData.
. */
dataDelimiter : ";",

/**
* The max value in the chart based on the current data. Will change
* If the data changes.
*/
ceiling : 0,

/**
* Flag if data item labels should be displayed.
*/
showValues : true,

showPercent : true,

/**
* Controls how far above the columns the values are positioned.
*/
valuesOffsetY : -13,

/**
* The legend element.
*/
legend : null,

/**
* Flag if the legend should be displayed.
*/
showLegend : true,

/**
* List of colors.
*/
colors : new Array(
"#5095D0",
"#7A67E5",
"#C956E9",
"#FC79C7",
"#CF6164",
"#B0783B",
"#A6A06C",
"#7F9B46",
"#8DB789",
"#3FBD76"
),

/**
* Marker to keep track of which color will be used.
*/
colorIndex : 0,

dataSum : 0,

/**
* Debug flag.
*/
debug : false,

/**
* A string array containing debug information.
*/
debugInfo : null,

/**
* Initialize the graph object.
*/
init : function(containerId) {
o = this;
o.debug = false;
o.debugInfo = new Array();
o.data = null;
o.ceiling = 0;
o.showValues = true;
o.showPercent = true;
o.showLegend = true;
o.legend = null;
o.colorIndex = 0;

o.container = document.getElementById(containerId);

o.debugInfo.push("init: Initializing the chart.");

if (o.container == null) {
o.debugInfo.push("init: (ERROR) Could not find the chart container element.");
return;
}

/*
* If the container element does not have any width and height
* we will set some defaults.
*/
if (o.container.style.width == "") {
o.container.style.width = "100%";
}

if (o.container.style.height == "") {
o.container.style.height = "300px";
}

},

/**
* Set the chart data from a delimited string in the following format:
* "item1;value1;item2;value2".
*/
setData : function(dataString) {
o.data = dataString.split(o.dataDelimiter);
if (o.data.length%2) {
o.debugInfo.push("setData: (ERROR) Data items does not match data values.");
o.data = new Array();
}
},

/**
* Sets the max value for the current chart. Done by finding the
* item with the highest value in the o.data array and then rounding
* it up to the next appropriate value.
*/
setCeiling : function() {
if (o.data == null || o.data.length &lt; 1) {
o.debugInfo.push("setCeiling: Data is null or length is zero.");
return false;
}

// Iterate through all the data values and find the highest value.
for (i=0;i&lt;o.data.length;i+=2) {
var dataValue = new Number(o.data[i+1].replace(/,/g, "."));
o.dataSum += dataValue;

if (dataValue &gt; o.ceiling) {
o.ceiling = dataValue;
}
}

/*
* Here we take the highest value that we found and round it up
* to an appropriate number which will represent our top value
* in the chart.
*/
var p = 1;
p = o.ceiling &lt; 10 ? 0 : p; // By 1
p = o.ceiling &gt;= 10 &amp;&amp; o.ceiling &lt; 100 ? -1 : p; // 10
p = o.ceiling &gt;= 100 &amp;&amp; o.ceiling &lt; 1000 ? -2 : p; // 100
p = o.ceiling &gt;= 1000 &amp;&amp; o.ceiling &lt; 10000 ? -3 : p; // 1000
p = o.ceiling &gt;= 10000 &amp;&amp; o.ceiling &lt; 100000 ? -4 : p; // 10000
p = o.ceiling &gt;= 100000 &amp;&amp; o.ceiling &lt; 1000000 ? -5 : p; // 100000
p = o.ceiling &gt;= 1000000 &amp;&amp; o.ceiling &lt; 10000000 ? -6 : p; // 100000

o.ceiling = Math.ceil(o.ceiling * Math.pow(10,p))/Math.pow(10,p);

o.debugInfo.push("setCeiling: Ceiling is set to: " + o.ceiling);
},

/**
* Render the graph on screen. Appends elements to the container element.
* This method sets some crusial style properties to the elements to make
* the chart render correctly.
*/
render : function() {
// Specify heights in percent.
var titleHeight = 10;
var legendHeight = 15;
var debugHeight = 20;

var chartArea;
var chartTitle;
var plotArea;

// Create the chart title.
chartTitle = document.createElement("div");
chartTitle.id = "chartTitle";
chartTitle.className = "chartTitle";
chartTitle.style.position = "relative";
chartTitle.style.height = titleHeight + "%";
chartTitle.style.textAlign = "left";
chartTitle.innerHTML = o.title;

// Create the outer-most chart container called the "Chart area".
chartArea = document.createElement("div");
chartArea.id = "chartArea";
chartArea.className = "chartArea";
chartArea.style.position = "relative";
chartArea.style.height = o.debug ? (100 - (titleHeight + debugHeight)) + "%" : (100 - titleHeight) + "%";

// Create the "Plot area".
plotArea = document.createElement("div");
plotArea.id = "plotArea";
plotArea.className = "plotArea";
plotArea.style.position = "relative";
plotArea.style.height = o.showLegend ? (95 - legendHeight) + "%" : "95%";
plotArea.style.marginLeft = "5px";
plotArea.style.marginRight = "5px";
plotArea.style.marginTop = "5px";
plotArea.style.marginBottom = "5px";

// Check if the chart has been provided with any data.
if (o.data == null) {
o.debugInfo.push("render: (ERROR) Data appears to be null.");
return;
}

o.debugInfo.push("render: " + (o.data.length / 2) + " data items found.");

// Calculate the ceiling value for the chart.
o.setCeiling();

// Create the grid lines.
if (o.type == "column") {
plotArea.appendChild(o.getColumnGrid());
} else if (o.type == "bar") {
plotArea.appendChild(o.getBarGrid());
}

// Create the bars/columns table.
if (o.type == "column") {
plotArea.appendChild(o.getColumns());
} else if (o.type == "bar") {
plotArea.appendChild(o.getBars());
}

// Append the the plot area.
chartArea.appendChild(plotArea);

// Append the legend if the showLegend flag is true.
if (o.showLegend) {
if (o.legend == null) {
o.debugInfo.push("render: (ERROR): Legend is null.");
} else {
chartArea.appendChild(o.legend);
}
}

o.container.appendChild(chartTitle);
o.container.appendChild(chartArea);

// Append the debug info if debug is true.
if (o.debug) {
var debugPane = document.createElement("div");
debugPane.className = "debugPane";
debugPane.style.height = "20%";
debugPane.style.overflow = "auto";
debugPane.innerHTML = o.getDebugInfo("&lt;br /&gt;");

o.container.appendChild(debugPane);
}
},

/**
* Generate column grid lines spaced according to the highest
* data point value.
* Returns a div element containing all grid line elements.
*/
getColumnGrid : function() {
var gridContainer;

gridContainer = document.createElement("div");
gridContainer.id = "gridContainer";
gridContainer.className = "gridContainer";
gridContainer.style.position = "absolute";
gridContainer.style.width = "100%";
gridContainer.style.height = "100%";

// Find out the increment for each grid line.
var increment = o.getGridIncrement();

var marker = increment;
while (marker &lt; o.ceiling) {
var gridLine = document.createElement("div");
gridLine.className = "gridLine";
gridLine.style.position = "absolute";
gridLine.style.width = "100%";

gridLine.style.borderBottomWidth = "1px";
gridLine.style.borderBottomStyle = "solid";
gridLine.style.borderBottomColor = "";

gridLine.style.bottom = ((marker / o.ceiling) * 100) + "%";

gridLine.innerHTML = marker;

gridContainer.appendChild(gridLine);


marker += increment;
}

return gridContainer;
},

/**
* Get the increment for the grid lines depending on th highest value
* in the chart.
*/
getGridIncrement : function() {
var increment = 0;
increment = o.ceiling &lt;= 10 ? 1 : increment; // 1
increment = o.ceiling &gt; 10 &amp;&amp; o.ceiling &lt;= 100 ? 10 : increment; // 10
increment = o.ceiling &gt; 100 &amp;&amp; o.ceiling &lt;= 1000 ? 100 : increment; // 100
increment = o.ceiling &gt; 1000 &amp;&amp; o.ceiling &lt;= 10000 ? 1000 : increment; // 1000
increment = o.ceiling &gt; 10000 &amp;&amp; o.ceiling &lt;= 100000 ? 10000 : increment; // 10000
increment = o.ceiling &gt; 100000 &amp;&amp; o.ceiling &lt;= 1000000 ? 100000 : increment; // 100000
increment = o.ceiling &gt; 1000000 &amp;&amp; o.ceiling &lt;= 10000000 ? 1000000 : increment; // 1000000
increment = o.ceiling &gt; 10000000 &amp;&amp; o.ceiling &lt;= 100000000 ? 10000000 : increment; // 10000000
increment = o.ceiling &gt; 100000000 &amp;&amp; o.ceiling &lt;= 1000000000 ? 100000000 : increment; // 100000000

return increment;
},

/**
* Generates a columns table. A table is actually nice
* because it eases the spacing between the columns.
* This method contains some crucial style properties for
* making the chart render correctly.
*/
getColumns : function() {
var table = document.createElement("table");
table.id = "plotTable";
table.cellSpacing = "0";
table.cellPadding = "0";
table.border = "0";
table.style.position = "absolute";
table.style.width = "90%";
table.style.height = "100%";
table.style.right = "0px";

var body = document.createElement("tbody");
var row = document.createElement("tr");

// Iterate the data array and create columns for each data item.
for (i=0;i&lt;o.data.length;i+=2) {
var cell;

cell = document.createElement("td");
cell.align = "middle";
cell.vAlign = "bottom";
cell.style.height = "100%";
cell.style.width = (parseInt(table.style.width) / (o.data.length / 2)) + "%";

/*
* Append the data item column to the cell. The column is
* returned ready-formatted with the proper height, color
* and labels.
*/
var dataItemLabel = o.data[i];
var dataItemValue = o.data[i+1].replace(/,/g, ".");
var columnElement = o.getColumn(dataItemLabel, dataItemValue);
cell.appendChild(columnElement);

// If labels should be displayed we append them to the column.
if (o.showValues) {
var valueElement = o.getColumnValue(dataItemValue);
columnElement.appendChild(valueElement);
}

// Append each cell to the row.
row.appendChild(cell);
}

// Append the row to the table.
body.appendChild(row);
table.appendChild(body);

return table;
},

/**
* Generates a column representing a data item.
* Returns the element.
*/
getColumn : function(dataItemLabel, dataItemValue) {
// Create the actual column and set the hight according to the data item's value.
var column;
column = document.createElement("div");
column.className = "dataPoint";
column.style.position = "relative";
column.style.width = "90%";
column.style.height = ((dataItemValue / o.ceiling) * 100) + "%";
if (parseInt(column.style.height) == 0) {
column.style.height = "1px";
}
if (o.showValues == false) {
column.style.fontSize = "0px";
}

// Find the correct color for the data point.
var dataItemColor = o.getColor();
column.style.background = dataItemColor;

// Append the the item to the legend.
o.appendToLegend(dataItemLabel, dataItemColor, dataItemValue);

return column;
},

/**
* Get the element for the column value label.
*/
getColumnValue : function(dataItemValue) {
// Create the value text associated with the data item.
var value;
value = document.createElement("div");
value.className = "value";
value.style.position = "absolute";
value.style.left = "0px";
value.style.width = "100%";
value.style.marginTop = o.valuesOffsetY + "px";
value.style.textAlign = "center";
value.style.whiteSpace = "nowrap";

if (o.showPercent) {
var v = new Number(dataItemValue) * 100 / o.dataSum;
var percent = "(" + Math.ceil(v) + "%)"

value.innerHTML = dataItemValue+percent;
} else {
value.innerHTML = dataItemValue;
}

return value;
},

/**
* Generate bar grid lines spaced according to the highest
* data point value.
* Returns a div element containing all grid line elements.
*/
getBarGrid : function() {
var gridContainer;

gridContainer = document.createElement("div");
gridContainer.id = "gridContainer";
gridContainer.className = "gridContainer";
gridContainer.style.position = "absolute";
gridContainer.style.width = "100%";
gridContainer.style.height = "100%";

// Find out the increment for each grid line.
var increment = o.getGridIncrement();

var marker = increment;
while (marker &lt; o.ceiling) {
var gridLine = document.createElement("div");
gridLine.className = "gridLine";
gridLine.style.position = "absolute";
gridLine.style.height = "100%";

gridLine.style.borderLeftWidth = "1px";
gridLine.style.borderLeftStyle = "solid";
gridLine.style.borderLeftColor = "";

gridLine.style.left = ((marker / o.ceiling) * 100) + "%";

gridLine.innerHTML = marker;

gridContainer.appendChild(gridLine);


marker += increment;
}

return gridContainer;
},

/**
* Generates a bars table. A table is actually nice
* because it eases the spacing between the bars.
* This method contains some crucial style properties for
* making the chart render correctly.
*/
getBars : function() {
var table = document.createElement("table");
table.id = "plotTable";
table.cellSpacing = "0";
table.cellPadding = "0";
table.border = "0";
table.style.position = "absolute";
table.style.width = "100%";
table.style.height = "90%";
table.style.bottom = "0px";

var body = document.createElement("tbody");

// Iterate the data array and create rows for each data item.
for (i=0;i&lt;o.data.length;i+=2) {
var row = document.createElement("tr");
var cell = document.createElement("td");
cell.style.width = "100%";
cell.style.height = (parseInt(table.style.height) / (o.data.length / 2)) + "%";

/*
* Append the data item to the cell. The bar is
* returned ready-formatted with the proper height, color
* and labels.
*/
var dataItemLabel = o.data[i];
var dataItemValue = o.data[i+1].replace(/,/g, ".");
var barElement = o.getBar(dataItemLabel, dataItemValue);
cell.appendChild(barElement);

// Append each cell to the row.
row.appendChild(cell);

// Append the row to the table.
body.appendChild(row);
}

table.appendChild(body);

return table;
},

/**
* Generates a bar representing a data item.
* Returns the element.
*/
getBar : function(dataItemLabel, dataItemValue) {
// Create the actual bar and set the width according to the data item's value.
var bar;
bar = document.createElement("div");
bar.className = "dataPoint";
bar.style.position = "relative";
bar.style.height = "90%";
bar.style.width = ((dataItemValue / o.ceiling) * 100) + "%";
if (parseInt(bar.style.width) == 0) {
bar.style.width = "1px";
}
if (o.showValues == false) {
bar.style.fontSize = "0px";
}

// Find the correct color for the data point.
var dataItemColor = o.getColor();
bar.style.background = dataItemColor;

// If labels should be displayed we append them to the bar.
if (o.showValues) {
var valueElement = o.getBarValue(dataItemValue);
bar.appendChild(valueElement);
}

// Append the the item to the legend.
o.appendToLegend(dataItemLabel, dataItemColor, dataItemValue);

return bar;
},

/**
* Get the element for the bar value label.
*/
getBarValue : function(dataItemValue) {
// Create the value text associated with the data item.
var value;
value = document.createElement("div");
value.className = "value";
value.style.position = "absolute";
value.style.width = "100%";
value.style.height = "100%";
value.style.textAlign = "right";
value.style.whiteSpace = "nowrap";

if (o.showPercent) {
var v = new Number(dataItemValue) * 100 / o.dataSum;
var percent = "(" + Math.ceil(v) + "%)"

value.innerHTML = dataItemValue+percent;
} else {
value.innerHTML = dataItemValue;
}

return value;
},

/**
* Gets a color by o.colorIndex
*/
getColor : function() {
if (o.colorIndex &gt;= o.colors.length) {
o.colorIndex = 0;
}

var color = o.colors[o.colorIndex];
o.colorIndex++;

return color;
},

/**
* Get the legend. The legend container element is populated
* during the creation of the columns.
*/
appendToLegend : function(dataItemLabel, dataItemColor, dataItemValue) {
if (o.legend == null) {
o.legend = document.createElement("div");
o.legend.className = "legend";
o.legend.style.position = "relative";
o.legend.style.marginLeft = "5px";
o.legend.style.marginRight = "5px";
}

// The legend item
var legendItem = document.createElement("span");
legendItem.className = "item";
legendItem.style.borderLeftWidth = "10px";
legendItem.style.borderLeftStyle = "solid";
legendItem.style.borderLeftColor = dataItemColor;
legendItem.style.paddingLeft = "2px";
legendItem.style.marginRight = "5px";
legendItem.style.whiteSpace = "nowrap";

if (o.showPercent) {
var v = new Number(dataItemValue) * 100 / o.dataSum;
var percent = "(" + Math.ceil(v) + "%)"

legendItem.innerHTML = dataItemLabel + percent;
} else {
legendItem.innerHTML = dataItemLabel;
}

o.legend.appendChild(legendItem);
o.legend.appendChild(document.createTextNode(" "));
},

/**
* Debug the chart object. Iterates the debugInfo array and creates
* a string. The method only returns the formatted string. It is up to
* you to print it to the browser or alert it.
*/
getDebugInfo : function(linebreakString) {
var debugString = "";

for (i=0;i&lt;o.debugInfo.length;i++) {
debugString += "- " + o.debugInfo[i] + linebreakString;
}

return debugString;
}
}</pre>
GeneralReading Chart Data from a .CSV FIle: Client-Side Chart Pin
M TURNER27-Feb-08 14:11
M TURNER27-Feb-08 14:11 
GeneralRe: Reading Chart Data from a .CSV FIle: Client-Side Chart Pin
Magnus Lundahl14-Mar-08 22:21
Magnus Lundahl14-Mar-08 22:21 
Generalreally good and simple chart script Pin
wizera21-Feb-08 8:40
wizera21-Feb-08 8:40 
GeneralRe: really good and simple chart script Pin
Magnus Lundahl14-Mar-08 22:40
Magnus Lundahl14-Mar-08 22:40 
GeneralThe JS chart appears different in Safari Pin
victorbos16-Aug-07 4:29
victorbos16-Aug-07 4:29 
GeneralRe: The JS chart appears different in Safari Pin
Magnus Lundahl16-Aug-07 21:51
Magnus Lundahl16-Aug-07 21:51 
GeneralThanks Pin
victorbos14-Aug-07 12:54
victorbos14-Aug-07 12:54 

General General    News News    Suggestion Suggestion    Question Question    Bug Bug    Answer Answer    Joke Joke    Praise Praise    Rant Rant    Admin Admin   

Use Ctrl+Left/Right to switch messages, Ctrl+Up/Down to switch threads, Ctrl+Shift+Left/Right to switch pages.