Introduction
The arcane art of code profiling or tuning may seem unnecessary with today's
desktop CPU's cranking out 2.2 GHz, which is pretty crazy pixel pushing power if you ask me.
The release of .NET seems to promote machine abstraction, with more benefits to the time/cost aware programmer.
However if you're more interested in writing code for the pure enjoyment of writing code, rather
than making money, you're probably just as interested in writing fast code. Depending on how intimate
you care to get with your current machine, they are some pretty cool optimizations you can perform to
squeeze every last redundant clock out of your code. Because assembly language is about as popular
as machine code, far harder to read and makes you "REALLY" machine dependent, I will ignore the common
optimizations performed in assembly. In any high level language there are some simple optimizations
you can perform which will reduce the code size and cycles required to execute it; probably the most
over-looked method of optimizing would be the algorithm you use.
Consider the following add/delete/insert functions as an example:
-
Add (Index)
- Adds an item to the currently indexed element and pushes trailing elements in the array down by one. -
Del (Index)
- Removes the indexed element from the array and pulls trailing elements in the array up by one. -
Ins (Index)
- Inserts/overwrites an item at the currently indexed element
Add(Index, newItem)
{
}
Del(Index)
{
}
Ins(Index, newItem)
{
}
The Insert function, programmed this way, would cause code bloat; one simple solution
for the redundancy is to design Insert() this way:
Ins(Index, newItem)
{
    Del(Index);
    Add(Index, newItem);
}
Note: If you wanted Insert() to add elements when the Index was out of bounds and NOT just overwrite
the current indexed element in the array you would need to add more memory managing routines which would
complicate your code and management. By having Add() manage this and making
Insert() call Del(), Add() you
now have removed a lot of unnecessary code and left tricky memory allocations to only 2 functions rather
than three. If you one day decide to use Virtual memory instead of Heap it's a whole lot easier to manage.
You now have seen an example of poor algorithm design and redundant code removal so let's move on to less
obvious code tweaking techniques.
Now we'll talk speed enhancements, rather than code size:
If you ever cross paths with any old game/graphics or assembly book you'll often read about
bit shifting "A faster multiplication/division". It (I reluctantly speak in past tense, as I don't know
if bit shifting is still faster) was a commonly known quirk of the 80x86 instruction set(s) that shifting was
a faster method of doing division or multiplication by powers of 2.
1
2631
8426 8421
=========
0000 0001 = 1
0000 0010 = 2  -> left-shift by one multiplied the value by two
0000 0100 = 4  -> left-shift by one multiplied the value by two again
Of course this is only useful for integer division/multiplication. Basically as a general rule of thumb:
int result = b * 2;
is faster if you write
int result = b << 1;
These are some common, easy to apply optimizations in any language that supports bit shifting.
Some other optimizations that don't require intimate knowledge of the
computer architecture are given below.
Removal of loop invariants
for(int x=0;x<=10000;x++){
    rect[x].left = nSpace + nWidth;
}
would be more efficient like this
temp = nSpace + nWidth;

for(int x=0;x<=10000;x++){
    rect[x].left = temp;
}
In the first example you're making a unnecessary addition calculation 10001 times, whereas the second calculates
the variable prior to iterating the array.
Common sub-expression elimination
result = a*((a+b+c)+b*(a+b+c)+c);
would be more efficient like this
temp = a+b+c;
result = a*(temp+b*temp+c);
In the above your calculating a redundant expression only once instead of twice (like the first)
and storing it in a intermediate variable, thus you get faster (and I think) smaller code when compiled.
These are just two common code optimization techniques you can easily apply to your own code.
There are, however, quite a few more techniques you can perform and, depending on your compiler,
several automatic optimizations available to you. However I will ignore these for the sake of brevity.
You now have an idea of how easy it is to optimize your code,
so without further delay I'll explain how my profiler works (or should anyway), but first the basics of profiling.
What is code profiling?
Code profiling records the clock cycles expended by your profiled section of code or function.
By repeatedly profiling your code, you get a clear picture as to which functions or sections of
code are causing bottlenecks or hot spots. After you localize your bottleneck it's then just a
matter of applying the techniques mentioned above (and more) to lower the number of clock cycles
used in your function or section of code.
What are clocks...?
Clocks or clock cycles are what the instructions on your CPU consume to execute tasks.
When you write code in a HLL (high level language) your compiler outputs a list of
instructions native to the target machine. Each instruction requires so many clock cycles to execute.
Hypothetically speaking, assume the ADD instruction needs 4 cycles to execute,
if your computer is the newest Pentium 4 rated at 2.2 GHz (2, 200, 000, 000 cycles per second) then your CPU could execute:
2200000000 cycles per second / 4 clocks for ADD instruction = 550000000 adds in ONE second. That's blazing speed huh...?
History:
After thinking about how code profiling actually worked I decided to visit Intel's site
and download their VTune program (Free for 30 days). However after downloading and playing
with it for only a few minutes I decided it offered far to many features, bells, and whistles
for simply profiling my MFC code. I'm not designing the autopilot on shuttle Discovery, why would
I need all this info? So I sat down and started to think of a quick and dirty solution. Naturally
recording the elapsed time from function invocation to function return immediately came to mind,
but how do you do this? And accurately? I started asking around CP and many people answered
GetTickCount and QueryPerformanceCounter. I knew that GetTickCount wasn't
exactly high performance, so I opted for
QueryPerformanceCounter. After about 7 hours of development and searching
the NET for resources on the subject at hand, I stumbled across
CProfile on CodeGuru...at last an example.
The first example on CG I ran across used the following approach to profiling code. It's a class that uses
GetTickCount and two member functions Start and Finish (I think) and I believe
optionally outputs a log file to disk or debug output window. The major benefit to this class is that
by using the two functions you can be more local to what you want to analyze;
you maintain total control over what you profile. If you know precisely where your bottleneck is,
you can profile exactly that code only...and better observe enhancements you make.
If you know of this example, you probably read the comments at the bottom of
the article, where someone suggests he's developed a better profiling class. This class is more object
oriented (friendly)? Instead of explicitly supplying the start and end of your profiled section of
code, you rely on the constructor to start recording and destructor to stop recording. This means you're less likely to get faulty profile timings because now you're guaranteed to have properly recorded start and stop times. If you forget the stop () in the other class, then obviously your
going to have incorrect measurement of clocks expended. The drawback to this method is that now you don't have direct control over the code section you want to profile. Profiling starts whenever the object is instantiated and stops whenever the object is destroyed or goes out of scope. An interesting message post at the bottom of this article had another guy stating that
QueryPerformanceCounter had known issues and wasn't as accurate as one would initially believe.
I did some more research and found a few sites that discussed the QueryPerformanceCounter function;
all had negative things to say, but nothing really concrete. Following my instincts I decided
to read up a little more about a RTDSC instruction that was Intel's own, which I had read about a while back.
Solution found! I'll use this instruction instead of the 2 Windows functions. Some drawbacks,
however, are still present, since my
CProfile class will be tied to Intel platforms ONLY! That was no big deal, because
I wasn't going to post the code, but now that I have it might be for some people. Sorry!
The CProfile class I developed uses the RDTSC (read-time stamp counter)
instruction...I believe this to be the most accurate method available (for those with supporting
architectures anyway). The design is similar to the second mentioned class, starting and stopping
clock cycle recording occurs at construction and destruction. Only I designed with DEBUG mode in
mind, so you don't actually instantiate the object with normal syntax, but rather the with the macro provided.
This offers a cool advantage over the other 2 classes. Now you can plug a PROFILER macro in
every function in your code (at the very beginning of each function) and leave it there...it acts like an
ASSERT or TRACE macro...it only compiles under debug mode...it's not included in release.
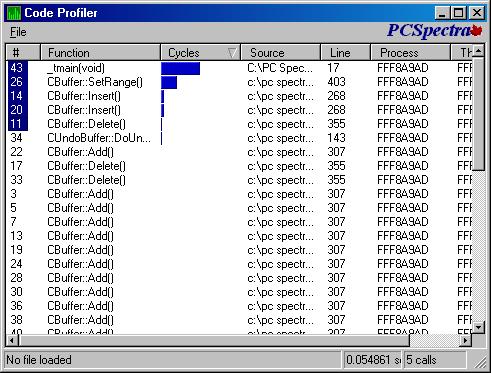
All three (I believe) create log files...but what good is a log file without tools to view all
the data? So I wrote a quick and dirty utility to load and view the profiled data. I
did loose interest in the project rather quickly (something else has my attention now) so
there are many improvements to be made. My hope is that by sharing with you, you'll share
with me and let me know about bugs; fixes would be great! I ask that if you add anything
or change anything, you send me the updated code so I can keep this project alive. I'll make
sure to make mention of your name, I promise.
The following I owe great thanks to. Not just for this project, but for any problem they help me solve.
Helped being the keyword here though, so don't expect anything when I make billions.
Credits:
- Roger Wright - Proofed this article and showed me proper usage of semi-colons, although I may have changed a few
- Joaquin - Huge help in writing a previous buffer class, showed me the coolest and most efficient way of using templates
- Christian Graus and Nish - Both speed up my development 10 fold when offering solutions I want today NOT tomorrow.
- Kilowatt - Reminded me that
OnNcPaint is sometime an excellent place to paint - Rick York - Made some corrections to the first draft and gave me some tools/info which I plan on including in my next update.
And of course the author of the CSortListCtrl for a job well done!!!
Known Bugs:
None…what, are you kidding?
Somewhere in the utility program I think I have used a long instead of
double or __int64. When working with clocks this can mean loss of data. If
you find what I think I'm looking for please inform me.
Other than that the code is pretty sloppy, so if you see the lack of const's or
clarity somewhere please let me know and I'll change it, or you can change it and send me
the adjusted code. One problem I realized late in development was that some functions will rate really high
in the clocks, which kind of overshadows the other profiled functions. Using the
status bar in the
list view doesn't help and isn't very accurate to view, so I plan on designing a
graph of sorts for displaying the data more accurately. Like I said above there is much code to be re-done,
so by all means have a crack at it.
I plan on updating my current version of VC++ to VC++ .NET someday and I am curious to know
if inline assembler is still available (with all that fancy byte code stuff). If you know of a
more future friendly design, let me know and i'll start thinking of tomorrow, today.
Bug Fixes:
None yet!
This member has not yet provided a Biography. Assume it's interesting and varied, and probably something to do with programming.


 General
  News
News  Suggestion
  Question
  Bug
Bug  Answer
  Joke
Joke  Praise
  Rant
Rant  Admin
Admin 


