Introduction
This article will use a sample MFC/C++ application to demonstrate the capabilities of the new Visual Studio 2008 debugger, specifically, debugging threads.
Background
A description of demonstrating the new thread debug window that comes as part of the Visual C++ 2008 Express Edition has been presented here. The reader should have a sufficient knowledge of threads on Windows platforms and a working knowledge of C++ and MFC.
The reader should download a copy of the Visual C++ 2008 Express Edition. In addition, the user must have a C:\Program Files\Microsoft Visual Studio 8\VC\atlmfc folder present on his/her computer. I did this by using the atlmfc folder with Visual Studio 2005 on my machine, and copying the atlmfc folder to the appropriate place for the Visual C++ 2008 Express Edition, since the free download doesn't come with an atlmfc folder. This technique should work perfectly fine for the purposes of this article. Downloads for Visual Studio 2008 Express Edition (Beta) are obtained here.
Using the Code
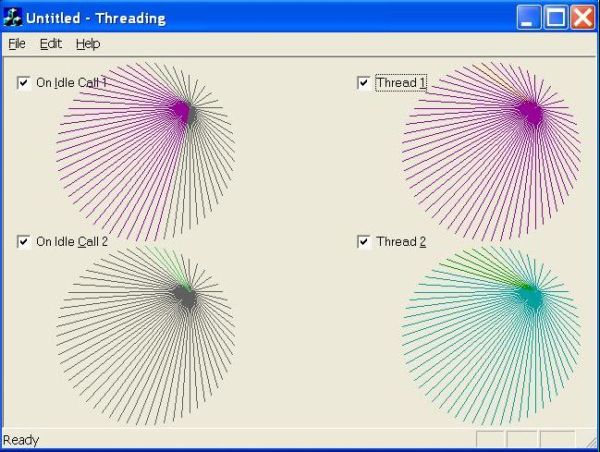
To use the tutorial, start up the application and click the check boxes shown. The main view (CTaskingView) derives from CFormView. It is an SDI app, so apart from the standard MFC derived classes, of App, Doc, and View, the application has a unique class of its own called CSpinner which is derived from CObject. The CSpinner is responsible for drawing "spinner" type objects on the screen adjacent to the check boxes. Each "spinner" has a set of colors that it cycles through, and the code makes extensive use of Device Context drawing with the CDC class. The main point of the entire application is not the CSpinner class but using each spinner to illustrate some processing that gets performed in response to GUI inputs. Two of the "spinners" are reserved for OnIdle processing and two others are reserved for execution on worker threads.
For a peek at what is going on with the drawing code, we can examine the Draw() function of the CSpinner class:
void CSpinner::Draw()
{
CDC *pDC = m_pViewWnd->GetDC();
pDC->SetMapMode (MM_LOENGLISH);
CPoint org = m_pCenter;
CPoint pStartPoint;
pStartPoint.x = (m_iRadius / 2);
pStartPoint.y = (m_iRadius / 2);
org.x = m_pCenter.x + (m_iRadius / 2);
org.y = m_pCenter.y + m_iRadius;
pDC->SetViewportOrg(org.x, org.y);
CPoint pEndPoint;
double nRadians = (double) (m_nMinute * 6) * 0.017453292;
pEndPoint.x = (int) (m_iRadius * sin(nRadians));
pEndPoint.y = (int) (m_iRadius * cos(nRadians));
CPen pen(PS_SOLID, 0, m_crColors[m_crColor]);
CPen* pOldPen = pDC->SelectObject(&pen);
pDC->MoveTo (pEndPoint);
pDC->LineTo (pStartPoint);
pDC->SelectObject(&pOldPen);
m_pViewWnd->ReleaseDC(pDC);
if (++m_nMinute == 60)
{
m_nMinute = 0;
if (++m_crColor == 8)
m_crColor = 0;
}
}
Pay close attention to the fact that the above code doesn't loop to draw lines on the screen. It does truly just "draw" one line at a single time. In order for the drawing to occur repeatedly, we have an endless loop installed in our thread function. We can "get away" with this seemingly bad coding by controlling Suspending and Resuming the threads during execution of the app.
UINT CTaskingDoc::ThreadFunc(LPVOID pParam)
{
CSpinner* lpSpin = (CSpinner*)pParam;
while (TRUE)
lpSpin->Draw(); return 0;
}
Also, if you check out the declaration of the above function in CTaskingDoc, you'll see it listed as a "static" member. This is necessary since the function passed to AfxBeginThread must be of the form "UINT Controlling_function_name(void parameter)".
It is important also to note that we truly only have two worker threads being spawned at any one time in our application. These are represented by the right hand side of the dialog box as "Thread 1" and "Thread 2." The other two checkboxes on the left side of our app, illustrate OnIdle processing! The reason why we include OnIdle calls becomes apparent when we talk about the Thread debugging window later in this article. For now, just note that the CSpinner::Draw() function is called a different way when we click "OnIdle call" check boxes, as shown below:
void CTaskingDoc::DoSpin(int nIndex)
{
m_cSpin[nIndex].Draw();
}
OnIdle repeatedly calls CTaskingDoc::DoSpin, which fires whenever there is "idle time," hence the name. Whenever the application's message queue is empty, OnIdle will fire. This is why when clicking on the screen, the OnIdle calls are momentarily stopped, until the user is finished. We should note that the application's message queue is independent of our two worker threads running.
Debugging Threads
Now that you have some familiarity with the way the code works, let's turn our attention to how the Thread debugger can be used to look at some interesting things within this sample code. Let's first refer to one last piece of our code:
void CTaskingDoc::SuspendSpinner(int nIndex, BOOL bSuspend)
{
if (!bSuspend)
{
if (m_pSpinThread[nIndex])
m_pSpinThread[nIndex]->SuspendThread();
}
else {
if (m_pSpinThread[nIndex])
{
m_pSpinThread[nIndex]->ResumeThread();
}
else
{
int iSpnr;
int iPriority;
switch (nIndex)
{
case 0:
iSpnr = 1;
iPriority = THREAD_PRIORITY_NORMAL;
break;
case 1:
iSpnr = 3;
iPriority = THREAD_PRIORITY_LOWEST;
break;
}
m_pSpinThread[nIndex] =
AfxBeginThread(ThreadFunc, (LPVOID)&m_cSpin[iSpnr],
iPriority);
}
}
}
The main thing to watch here is at the end of this function, the call to AfxBeginThread. Worker threads are created using this function, and also notice that at the same time we can set the priority of the new worker thread as well. In our example, we compare priorities "Normal" and "Lowest." We place a breakpoint at the beginning of the ::SuspendSpinner call to illustrate our usage of the Thread debugger.
Now start the application (in debug mode). Click on the application's check box labelled "Thread 1." You should hit our break point. Now, all that is left is select Debug->Windows->Threads from the IDE main menu. You'll see a window appear similar to the one shown below:

Notice a few things about this window. The ID and Name columns uniquely identify the thread. In this case, we are dealing with the main application thread, and no other threads have been created in our program! This makes sense, since AfxBeginThread has not been called yet, which brings us to our next step. You may put a second break point on the AfxBeginThread and press F5 to move the execution of the program a little further. A small note here. I like to use the keyboard shortcut keys, and for Visual C++ 2008 Express they are the same as Visual Studio 6.0 (in the Visual 2005 environment, they are slightly different). In any case, if you press F10 (step over) once, observe our new entry in the Thread Debug window!
Now, there are some things to take note of here. The color of the Main Thread is always green, Worker Threads are always in yellow. Also note that the priorities of both of these threads are "Normal," plus neither of these threads has been Suspended (Suspend == 0). There is also a neat little feature that you can try, place your cursor on the Name column, and right mouse click. There is an option to rename the thread to something meaningful (perhaps Thread1). This becomes extremely useful if we are debugging an application that makes use of many threads.
Press F5 to run our program a little further, but this time select "Thread 2" and pay close attention to what happens when we step just past the AfxBeginThread call. You probably guessed that our second worker thread would show up, and this time, the Priority is set to "Lowest." This matches how the thread was created if you observe the parameter fed to AfxBeginThread. You should see a window similar to the one below:
We included OnIdle processing in this article just to illustrate that really no new threads get generated in the application as a result of their calls. You may put a break point in the OnIdle calls, observe the Thread Debug window, and notice that no additional threads get created.
Now that we have created these two worker threads, and they are running in our application, you can click on either one of these (or both) of the check boxes and observe the Suspend column in our Thread debugging window get set to "1".
There is also one more "trick" concerning the Thread debugging window. At any time when using the debugging window, you may place your cursor over the execution pointer, and observe the call stack! Remember that all threads have their own execution stack, including the Main execution thread. Pretty neat, eh? Well, you have everything you need to begin using the Thread debugger in Visual C++ 2008 when it finally gets released, I'm told in February!
Reference
This code has been modified from the original in SAMS Teach Yourself Visual C++ 6 in 21 Days -- David Chapman with Jeff Heaton.
History
- Version 1.1.0 (Major, Minor, Patch)
Electrical Engineer that loves mathematics and C# and C++ programming and electronics. I dedicate all my codeproject articles to my son Jim, and daughter Ashley.


 General
  News
News  Suggestion
  Question
  Bug
Bug  Answer
  Joke
Joke  Praise
  Rant
Rant  Admin
Admin 


 . I might add some of your ideas from the video to my tutorial.