Introduction
In this article, I will discuss how to work with SSRS, i.e., reporting services provided by Microsoft.
In this, we take look at the following items step by step:
- Basic & Standard Definition of SSRS (SQL Server Reporting Services)
- Download Adventure Work Sample DB to work with reporting services
- Develop reports using Business Intelligence
Note: Prior to working on this sample, one should have installed Reporting services & configure reporting services and this article is developed using Microsoft SQL Server 2008, VS 2008 (Business Intelligence).
Basic & Standard Definition of SSRS (SQL Server Reporting Services)
- SQL Server Reporting Services (SSRS) is a server-based report generation software system from Microsoft.
- It can be used to prepare and deliver a variety of interactive and printed reports. It is administered via a web interface.
- Reports are defined in Report Definition Language (RDL), an XML markup language.
- Reports can be designed using recent versions of Microsoft Visual Studio, with the included Business Intelligence Projects plug-in installed or with the included Report Builder, a simplified tool that does not offer all the functionality of Visual Studio. Reports defined by RDL can be generated in a variety of formats[1] including Excel, PDF, CSV, XML, TIFF (and other image formats[2]), and HTML Web Archive. SQL Server 2008 SSRS can also prepare reports in Microsoft Word (DOC) format.
Download Adventure Work Sample DB to work with reporting services:
- Download Adventure work DB from the below link:
http://msftdbprodsamples.codeplex.com/releases/view/4004 - Install downloaded DB.
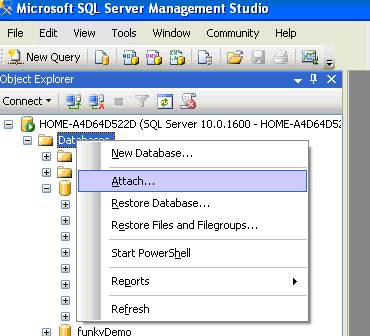
- Open Microsoft SQL Management Studio & connect to database.
- Right click Database option & click Attach option as shown below:
- Click on Add button and navigate to the path where Adventure DB is installed and select AdventureWorks_Data.mdf as shown below:

- Finally, you should be seeing
Adventure DB in the DB list as shown. Note if you have installed Reporting Services properly, you should be seeing ReportServer DB in the DB list as shown below. In my case, I have provided SSRS database names as ReportServer_DB, ReportServer_DBTempDB while configuring SSRS.
Develop Reports using Business Intelligence
- Open VS 2008, New Project, Business Intelligence Project, Report Server Project & name it as “
ReportPrj”.
- Now it will show up the below screen, click next.
- Now select New Data Source, Name:
Adventure, Type: Microsoft SQL Server & click Edit button.
- Select Servername, appropriate Authentication & select database as “
AdventureWorks”, click Test Connection. If everything is properly selected, Test connection would get succeeded as shown below:
- Click ok. In connection string text area, db connection string would show up. Click Next.
- Now enter the below query in the query string text area & click next button:
Select top 150 * from Sales.SalesOrderHeader
- Select tabular format, click next.
- Select fields from available fields area & click Details button, click next button.
- Now you can select table styles.
- Now it asks for report name, let's name it as
FirstReport & click Finish button.
- This would generate report “FirtReport.rdl” with two tabs in it. The tabs are “
Design”, “Preview”. - To change the color of a column in a report, go to design tab, select Header cell or Row cell, go to Properties tab & select appropriate color.
- To view the data, go to Preview tab & look at the data.
- To change or modify query.
- Select Design tab, now go to menu items select View, select Report data.
- Right click
Dataset1 under Adventure, select dataset properties.
- Change query or other properties as per your need.
- Finally right in solution explorer, click on solution & select deploy.
- After successful deployment, go to browser & open the reporting service URL. In my case, it is http://localhost/reportserver.
- Now you should be able to see the data.
Happy coding… hope this helps!


 General
  News
News  Suggestion
  Question
  Bug
Bug  Answer
  Joke
Joke  Praise
  Rant
Rant  Admin
Admin 


