Introduction
This illustrates how to build dynamic charts on the web using the ASP.NET chart controls. The earlier article provides you with an outline of the ASP.NET chart control. In my earlier article, the points are binded statically as shown below:
<Points>
    <asp:DataPoint AxisLabel="jon" XValue="5" YValues="4" />
    <asp:DataPoint AxisLabel="kon" XValue="15" YValues="44" />
    <asp:DataPoint AxisLabel="pol" XValue="85" YValues="90" />
</Points>
But no one is really interested in static charts. Graphs should be generated dynamically from datasources like Collection objects, datasources, etc.
Background
This article is the continuation of the below article:
Generating Dynamic Charts
This article mainly focuses on the dynamism of the charts, i.e adding the titles, series and datapoints dynamically. There are various ways we can generate the graphs dynamically but I could only present two methods.
Adding Titles
We can add the title in the below manner. Here Chart1 is the chart object id. By using the method Titles.Add() we can add the title to the chart.
Chart1.Titles.Add("Pass percentage of Students")
Adding Series
Similar to titles, we can also add the series label by Series.Add() method. Here Pass percentage is the legend of the series.
Chart1.Series.Add("Pass percentage")
Add Points and Axis Label
Finally we need to add the points to the series. Here the Series(0) indicate the first series.
There are two methods to add the points:
- By using
AddXY, Add, AddY overloading methods - By using the
DataBindXY overloading method
Method 1
Points.AddXY method is used to add the X and Y points to the chart. We can also add the axis label by assigning the labels to Points.Item(j).AxisLabel property. Here Item(j) indicates the Jth point.
Dim Yr As Int16 = 2000
Dim j As Int16 = 0
For i As Integer = 1 To 9
    Chart1.Series(0).Points.AddXY(i + 10, i + 15)
    Chart1.Series(0).Points.Item(j).AxisLabel = Yr
    Yr = Yr + 1
    j = j + 1
Next
Method 2
By using the DataBindXY method, we can directly bind the X,Y coordinates or even overload method is available for X, Y and Label:
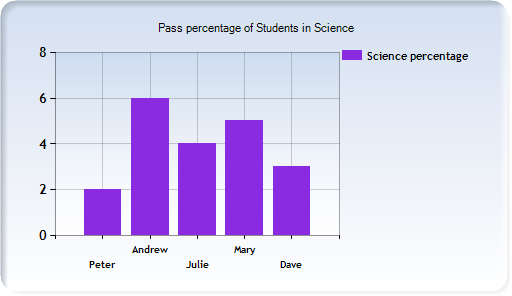
Dim xval As String() = {"Peter", "Andrew", "Julie", "Mary", "Dave"}
Dim yval As Double() = {2, 6, 4, 5, 3}
Chart2.Series(0).Points.DataBindXY(xval, yval)
Here DataBindXY has two overload methods:
- Takes X Axis, Y Axis
- Takes X Axis, X Field, Y Axis
In the above manner, we add the points to the charts. We can improve the interface by changing the properties of the control.
History
- 29th December, 2008: Initial post
Spends free time, working with new stuff from Microsoft and Web technologies. Recently started working on "Ruby on Rails" and other open source technologies.


 General
  News
News  Suggestion
  Question
  Bug
Bug  Answer
  Joke
Joke  Praise
  Rant
Rant  Admin
Admin 


