Introduction
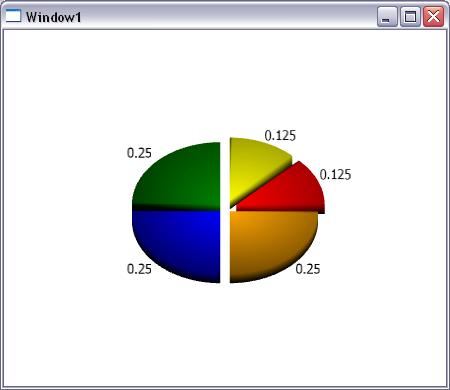
This article is just meant as a starter guide for creating a 3D pie chart in WPF. It's not meant to be a user control that you plug in, but rather give you a starting point with a minimum amount of code.
Background
I have the requirement to show statistical data in a 3D pie chart. So I did what everyone else does - search the web for an example. I didn't want to purchase a third party app since we were using WPF and it has support for 3D controls and what we were doing was pretty straight forward. I did find some examples but they were found lacking because:
- They were part of a larger library that contained a bunch of other 3D examples that I don't need.
- The code did much more than I needed.
- It didn't do exactly what I needed (e.g. show labels)
So I created my own project as a POC and here it is.
There is not much to the code - it all exists in the code behind for Window1 (Window1.xaml.cs).
The window contains a Viewport3D control where all the 3D objects will reside. In addition to the pie slices, it will contain the camera and the light source.
The bulk of the work is done in CreateSlice which given a starting point and a percentage calculates the width of the slice and creates a ModelUIElement3D to add to the Viewport3D. The advantage of using a ModelUIElement3D is that it has standard UI events you can listen to like MouseDown. To create the slice, I basically start at the origin, pull out the slice a little, then calculate the points along the edge of the slice. The more points you calculate, the smoother the curve will look. On XP, 3D controls are aliased so they will not look as nice. You can force this through some registry keys but it may not work on all systems.
int max = (int)(percent * 200);
mg.Positions.Add(new Point3D(0, 0, 0));
for (int i = 0; i <= max; i++)
{
Point ArcPoint = new Point((size * Math.Sin(currentAngle * 2 * Math.PI)),
(-size * Math.Cos(currentAngle * 2 * Math.PI)));
currentAngle += 0.005;
mg.Positions.Add(new Point3D(ArcPoint.X, ArcPoint.Y, 0));
}
Now I have the top layer of the pie.
max = mg.Positions.Count;
for (int i = 0; i < max; i++)
    CreateTriangle(mg, 0, i + 1, i + 2);
I then copy this collection of points and decrease the Z value to create the bottom part of the pie and then add in the sides.
for (int i = 0; i < max; i++)
mg.Positions.Add(new Point3D(mg.Positions[i].X, mg.Positions[i].Y, -3));
#region draw sides
CreateTriangle(mg, 0, max + 1, 1);
CreateTriangle(mg, max, max + 1, 0);
CreateTriangle(mg, max, max - 1, mg.Positions.Count - 1);
CreateTriangle(mg, max, 0, max - 1);
for (int i = 1; i < max; i++)
{
CreateTriangle(mg, i, i + max, i + 1);
CreateTriangle(mg, i + 1, i + max, i + max + 1);
}
#endregion
An event handler is used to listen to when the user clicks on the slice and the slice is added to the view port:
pieSlice.Model = gm;
pieSlice.MouseDown += new MouseButtonEventHandler(pieSlice_MouseDown);

pieSlice.Transform = new TranslateTransform3D(popOutPoint.X, popOutPoint.Y,0);
this.mainViewport.Children.Add(pieSlice);
To get the text to draw, I create a TextBlock and paint it on 2D plane which is positioned to the outer edge of the center of the pie slice.
When the user clicks on a slice, I change its DiffuseMaterial to make it stand out and then raise the slice along the Z axis.
Points of Interest
A few things to keep in mind when working with 3D graphics:
- When creating the triangles to display, the points must be added in a clockwise order.
- If edges of a triangle are shared (meaning the points), then the surface will look smooth due to how light is reflected off of them. If not, then you will see the individual lines. If you want to see harder edges, you can duplicate the points, or you can use Normals to customize however you wish. This example does not use Normals at all.
History
- 6th March, 2009: Initial post
This member has not yet provided a Biography. Assume it's interesting and varied, and probably something to do with programming.


