Introduction
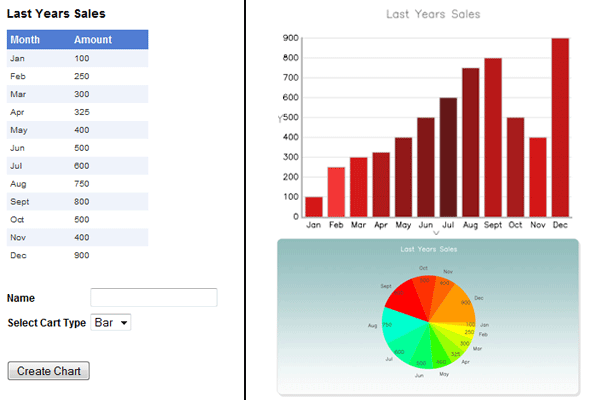
Let’s say you have the following task: your sales manger needs to see last year’s sales from their website. You could just create a table from the database displaying the data; however, it would be easier to read in a bar or pie chart.
For this article, I have made a simple database called data, and added a table called yearSales, and placed dummy data in to it. This is my first article, so please bear this in mind.
Background
You need to know the following: JS Charts and Andrew Urquhart's request query string script. You should also have basic knowledge of LINQ and XML.
Using the Code
Let’s start off by creating the first page (Default.aspx). On this page, I have created a simple GridView, a TextBox, a DropDownList, and a Button. This will simply display the data from the database on the GridView.
protected void Page_Load(object sender, EventArgs e)
{
    showSales();
}
private void showSales()
{
    companyDataDataContext db = new companyDataDataContext();

    var figures = from s in db.yearSales
                  select new { s.Month, s.Amount };
    GridView1.DataSource = figures;
    GridView1.DataBind();
}
You must include the following namespaces in order for this to work correctly:
using System;
using System.Collections.Generic;
using System.Linq;
using System.Xml.Linq;
using System.Web;
using System.Web.UI;
using System.Web.UI.WebControls;
Next, we need to create a method in order to get the following data in to an XML file (you need to create the XML file first, in the project). We also need to have some user input: in this case, the type of chart they require.
private void createChart()
{
    string t = DropDownList1.SelectedValue.ToString();

    companyDataDataContext db = new companyDataDataContext();

    XElement xml = new XElement("JSChart",
         new XElement("dataset",
             new XAttribute("type", t),
             from c in db.yearSales
             select new XElement("data",
                 new XAttribute("unit", c.Month),
                 new XAttribute("value", c.Amount)
                 )
             )
         );
    xml.Save(MapPath("sales.xml"));
}
Now, the button must run the createChart method; you must also pass the data from the text box and the drop down list in to a query string.
protected void Button1_Click(object sender, EventArgs e)
{
    createChart();
    string chname = TextBox1.Text;
    string t = DropDownList1.SelectedValue.ToString();
    Response.Redirect("showChart.aspx?name=" + chname + "&type=" + t);
}
Next page: in this page, we don't need to do much back-end coding; all we need to do is show the sales GridView.
protected void Page_Load(object sender, EventArgs e)
{
    showSales();
}
private void showSales()
{
    companyDataDataContext db = new companyDataDataContext();

    var figures = from s in db.yearSales
                  select new { s.Month, s.Amount };
    GridView1.DataSource = figures;
    GridView1.DataBind();
}
Now, let us look at the client-side coding, using JS Charts and the Request.QueryString function. We need to do some JavaScript coding in the <body> selection of the page.
var chartName = Request.QueryString("name");
var type = Request.QueryString("type");
var t = type.toString();

if (t == "bar") {
    var name = chartName.toString();
    var myColors = new Array('#CE0000', '#EF2323', '#D20202', '#A70000', '#850000',
                             '#740000', '#530000', '#850000', '#B00000',
                             '#9C0404', '#CE0000', '#BA0000');
    var myChart = new JSChart('graph', 'bar');
    myChart.setDataXML("sales.xml");
    myChart.setBarValues(false);
    myChart.setTitle(name);
    myChart.colorizeBars(myColors);
    myChart.setAxisValuesColor("#000000");
    myChart.draw();
}
else if (t == "pie") {
    var colors = ['#FFCC00', '#FFFF00', '#CCFF00', '#99FF00', '#33FF00', '#00FF66',
                  '#00FF99', '#00FFCC', '#FF0000', '#FF3300', '#FF6600', '#FF9900'];
    var chartName = Request.QueryString("name");
    var name = chartName.toString();
    var myChart = new JSChart('graph', 'pie');
    myChart.setDataXML("sales.xml");
    myChart.setTitle(name);
    myChart.colorizePie(colors);
    myChart.setPiePosition(308, 170);
    myChart.setPieRadius(95);
    myChart.setPieUnitsFontSize(8);
    myChart.setPieUnitsColor('#474747');
    myChart.setPieValuesColor('#474747');
    myChart.setPieValuesOffset(-10);
    myChart.setTitleColor('#fff');
    myChart.setSize(616, 321);
    myChart.setBackgroundImage('chart_bg.jpg');

    myChart.draw();
}
else {
    alert("You have incorrect Data in order to create a chart");
}
To explain the code a little more, all you need to do is request the query string which will create the chart the user asked for. That's it!
This is a simple but easy way to display data from a database in a chart.
Points of Interest
JS Charts is a really interesting JavaScript based chart generator, and it is free. There are many different things you could do with it. LINQ is a great way to get data from a database with out writing long T-SQL scripts, so if you have a simple query you need to do on your project, LINQ is the best option for it.
I'm a web developer based in the North West of England. I use c#/ASP.Net to developer my work
 General
  News
News  Suggestion
  Question
  Bug
Bug  Answer
  Joke
Joke  Praise
  Rant
Rant  Admin
Admin 


