Introduction
Computer Vision and programming go hand in hand. One needs to use programming to materialize the theory so it can be applied to real world problems. Computer Vision is an exciting field where we try to make sense of images. These images could be static or could be retrieved from videos. Making sense could be things like tracking an object, modeling the background, pattern recognition etc. This article is the first of a series of articles that will using C# to educate users in Computer Vision. Being the first article, I intend to introduce some basic concepts used in Computer Vision. I will refer back to these concepts in upcoming articles where I will implement a few state-of-the-art algorithms in Computer Vision, covering areas such as object tracking, background modeling, patter recognition etc.
Image Understanding
An image is composed of many dots called Pixels (Picture Elements). More the pixels, higher the resolution of the image. When an image is grabbed by the camera, it is often in RGB (Red Green Blue) format. RGB is one of many colour spaces used in Computer Vision. Other colour spaces include HSV, Lab, XYZ, YIQ etc. RGB is an additive colour space where we get different colours by mixing red, green, and blue values. In a 24-bit RGB image, the individual values of R, G, and B components range from 0 - 255. A 24-bit RGB image can represent 224 different colours, i.e., 16 million. OK, going back to the image, we humans see objects in there, where as the computer sees pixels having RGB values ranging from 0 - 255. So, there is an obvious need to build some kind of intelligence into computers so we can make them make sense of images.
If you want to pursue a career in Computer Vision, you have to understand one thing: Statistics & Probability! Normally, statistics would be used in creating a model, and probability would be used in making sense of the model. So, moving forward, I will try to explain some fundamentals required to understand an image so Computer Vision techniques can be applied to it.
Image Attributes
The very first step in modeling an image is to pick an attribute to be modeled. It does not have to be a single attribute - you would normally use a combination of attributes to make your algorithm robust. Some of the primary attributes include edges, colour etc. The attributes are chosen such that they are unique. But in reality, that is not the case. For example, if using colour, many images would share the same colour distribution. So, we need to find an attribute or a combination of attributes that provides a greater degree of uniqueness.
Attribute Modeling with Histogram
Once an attribute is chosen, the next step is to model it. There are many models available in Computer Vision - each with its pros and cons. But in this article, I will concentrate on histogram. The reason for selecting histogram is because it is very popular in Computer Vision, plus it forms the foundation for articles coming up. From elementary statistics, we know that a histogram is nothing more than a frequency distribution. Hence, a colour histogram is the frequency of different colours in the image.
Using normalisation, we can add scale invariance to a histogram. What that means is that the same object with different scales will have identical histograms. Normalisation is achieved by dividing the value of each bin by the total value of the bins.
To create a colour histogram, we first need to decide on the number of bins of the histogram. Generally speaking, the more bins you have, the more discriminatory power you get. But then, the flip side is that you need more computational resources. The second decision you need to make is how to implement this colour histogram. Remember that you normally would have three colour components, such as Red, Green, and Blue. A popular approach is either to use a 3D array or a single array. Using a 3D array is straightforward, but using a single array for three components require some thought. In the end, it is a matter of liking - I prefer the latter approach.
For a 16x16x16 bin histogram, we have 256/16 = 16 colour components per bin. So, we define a 3D array something like this:
[,,],float histogram = new float [16, 16, 16];
As an example, if the pixel's RGB value is 13, 232, and 211, then this means you are dealing with RGB bins 0, 14, and 13. These bin numbers are obtained by dividing the colour values by the number of bins - 16, in our case. There you have to increment the histogram [0, 14, 15] by 1. If we do that for all the pixels in an image, we would end up with the colour histogram of the image which tells us about the colour distribution in the image.
For a 16x16x16 bin histogram, we declare a 1D array like this:
[] float histogram = new float [16 * 16 * 16];
In order to use a 1D array, we need to define an indexing scheme so we can add and retrieve the values of the bins. The indexing method is given in the code below:
private int GetSingleBinIndex(int binCount1, int binCount2, int binCount3, BGRA* pixel)
{
int idx = 0;
int i1 = GetBinIndex(binCount1, (float)pixel->red, 255);
int i2 = GetBinIndex(binCount2, (float)pixel->green, 255);
int i3 = GetBinIndex(binCount3, (float)pixel->blue, 255);
idx = i1 + i2 * binCount1 + i3 * binCount1 * binCount2;
return idx;
}
Again, if the pixel's RGB value is 13, 232, and 211, then this means you are dealing with RGB bins 0, 14, and 13. This points to an index of 0 + 14 x 16 + 13 x 16 x 16 = 3552 in a 1D array. To create a histogram, you will increment the value of this bin by 1.
Model Matching
Once we have represented an image attribute as a histogram, we often need to perform recognition. So, we can have a source histogram and a candidate histogram, and match the histogram to see how closely the candidate object resembles the source object. There are many techniques available, such as Bhattacharyya Coefficient, Earth Movers Distance, Chi Squared, Euclidean Distance etc. In this article, I will describe the Bhattacharyya Coefficient. You can implement your own matching technique bearing in mind that each matching technique has its pros and cons.
The Bhattacharyya Coefficient works on normalised histograms with an identical number of bins. Given two histograms with p and q, the Bhattacharyya Coefficient is given as:

If you are like me and get discouraged by mathematical equations, then, don't worry: I have a worked example for you! Considering the following two histograms, the calculation of Bhattacharyya Coefficient is shown below:
As we can see, it requires us to multiply the bins. Furthermore, we can see that for identical histograms, the coefficient will be 1. The values of Bhattacharyya Coefficient ranges from 0 to 1, i.e., from least similar to exact match.
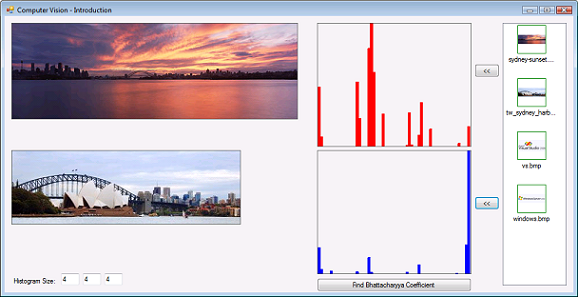
Using the Code
- Step 1: Select a histogram size - the default is 4x4x4.
- Step 2: Select an image from the list and click the top "<<" button to see its histogram.
- Step 3: Select an image from the list and click the bottom "<<" button to see its histogram.
- Step 4: Click the "Find Bhattacharyya Coefficient" button to see the coefficient. For the same images, it will be 1.
Points of Interest
Native image processing in .NET is slow! Using a Bitmap object with GetPixel() and SetPixel() methods is not the way to do image processing in .NET. We need to access the pixel data by using unsafe processing. I have used the code by Eric Gunnerson.
History
I have been in the IT industry since April 1996. My main expertise is in Microsoft space.
Coming from engineering background, any application of programming to engineering and related fields easily excites me. I like to use OO and design patterns and find them very useful.
I have been an avid reader of CodeProject. I decided it was time to make a commitment to make my contribution to the community - so here I am.
My Website: http://www.puresolutions-online.com


 General
  News
News  Suggestion
  Question
  Bug
Bug  Answer
  Joke
Joke  Praise
  Rant
Rant  Admin
Admin 


