Introduction
This article focuses on adding visual page and control-level debugging information to ASP.NET websites in a reusable way without inheriting from a custom Page or User Control base.
Background
There are two pieces of visual debug which I find particularly useful when working on large ASP.NET websites: the first is page load time gives a good indication of the overall page weight, in terms of getting the data, building the control hierarchy, and rendering the HTML. The second is user control source file location, ID, and whether its viewstate is enabled.
I've seen implementations where custom page or control base classes have been used with their Render method overwritten and the debug information inserted before or after the rendered content. I dislike this approach for a number of reasons, specifically:
- The visual page is littered with debug information making it difficult to see if the content has been rendered properly
- The HTML source is also littered with debug information, which makes it difficult to see if the source HTML has been rendered properly
- Performance is hindered because for each user control, a check needs to be made against a config flag to see if debug information is required
- The onus is on the developer to inherit from the base page or user control class
This list of reasons was enough for me to accept the challenge of prototyping a better way, and I've dubbed it 'Debug Injection'.
What is 'Debug Injection' and How Does it Work?
The idea was to create an HttpModule which would hook into various parts of the response pipeline and output the debug information in an unobtrusive manner; with great reuse to boot. Aside from the entry within the web.config, the website developer would need no knowledge of the debug injection workings or even prior knowledge that it would take place. The config reference to this module is removed completely from the production web.config, yielding improved performance (as no flag checking is required).
<modules>
  <add name="DebugModule" type="DebugModule.DebugHttpModule, DebugModule" />
</modules>
The module hooks into three events BeginRequest, PostMapRequestHandler, and EndRequest, where PostMapRequestHandler fires once the ASP.NET engine has worked out what type of response to generate (in our case, text/html).
public class DebugHttpModule : IHttpModule
{
#region IHttpModule Members
public void Init(HttpApplication context)
{
if (HttpContext.Current.IsDebuggingEnabled)
{
context.BeginRequest += new EventHandler(context_BeginRequest);
context.PostMapRequestHandler +=
new EventHandler(context_PostMapRequestHandler);
context.EndRequest += new EventHandler(context_EndRequest);
}
}
public void Dispose()
{
}
#endregion
private void context_BeginRequest(object sender, EventArgs e)
{
DebugPageInjection.InitialisePageDebug();
}
private void context_EndRequest(object sender, EventArgs e)
{
DebugPageInjection.CompletePageDebug();
}
private void context_PostMapRequestHandler(object sender, EventArgs e)
{
DebugPageInjection.InjectPageDebug(HttpContext.Current.Handler as Page);
}
}
Page Timing Injection
The Stopwatch class provides the timer for us, and adding it to HttpContext.Current.Items means we can get it back again later. The timing information is written directly into the output stream once all other processing has been completed, and for the sake of brevity, I've not included the code for outputting the pre-render timing, as it is almost identical to the CompletePageDebug method except that it hooks into the Page.PreRenderComplete event.
public static void InitialisePageDebug()
{
Stopwatch stopwatch = new Stopwatch();
HttpContext.Current.Items[PageStopWatchItemKey] = stopwatch;
stopwatch.Start();
}
public static void CompletePageDebug()
{
if (HttpContext.Current.Response.ContentType == ContentTypeHtml &&
HttpContext.Current.Response.StatusCode == 200)
{
Stopwatch stopwatch =
HttpContext.Current.Items[PageStopWatchItemKey] as Stopwatch;
if (stopwatch != null)
{
stopwatch.Stop();
WriteToResponse(HtmlComment.HtmlCommentFormat,
"Start Debug Injection - Page Total Time");
WriteToResponse(ResponseStringTotalTime,
stopwatch.ElapsedMilliseconds, "pageDebugPane");
WriteToResponse(HtmlComment.HtmlCommentFormat,
"End Debug Injection - Page Total Time");
}
}
}
User Control Debug Pane Injection
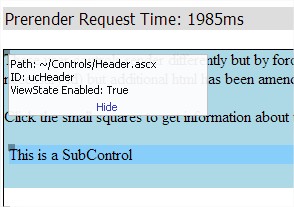
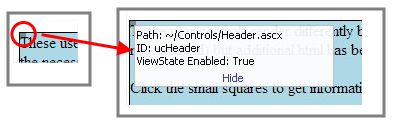
The objectives for user control debug information were to retain the original visual layout and retain the original source HTML (where possible); I wanted to use debug panes that would sit above the visual page rather than being part of it and only be visible when required; for this, I added a small square to the top left corner of each user control, which when clicked shows or hides the debug pane, like this:
Walking the Controls hierarchy
To do this, I hook into the Page.LoadComplete event and recursively walk through the control hierarchy, and for user control, I add a debug pane to the end of the page's Controls collection. I created a DebugControlItem class which contains a property bag of the debug information, and added it to the Page.Items dictionary - this was for an improvement that I didn't get a chance to implement (see the Future Improvements section).
private static void AddDebugControl(Page page, ControlCollection controls)
{
  int count = controls.Count;
  for (int i = 0; i < count; i++)
  {
    Control c = controls[i];
    UserControl uc = c as UserControl;

    if (uc != null && uc.Visible && uc.Controls.Count != 0)
    {
      page.Controls.Add(new DebugPaneControl() { ControlToDebug = uc });

      EnsureClientID(uc);
      CreateDebugControlItem(uc);
    }

    AddDebugControl(page, c.Controls);
  }
}

private static void CreateDebugControlItem(UserControl control)
{
    DebugControlItem debugItem = new DebugControlItem();
    debugItem.Properties.Add("Path", control.AppRelativeVirtualPath);
    debugItem.Properties.Add("ID", control.ID);
    debugItem.Properties.Add("ViewState Enabled", control.EnableViewState.ToString());

    control.Page.Items[string.Format(DebugPropertyBagKeyFormat,
                       control.UniqueID)] = debugItem;
}
The debug pane is rendered out with all the other controls; notice however, that it is at the end of the actual content controls rather than being mixed in.
public class DebugPaneControl : WebControl
{
    ...

    protected override void Render(HtmlTextWriter writer)
    {
        if (this.ControlToDebug != null && this.ControlToDebug.Controls.Count != 0)
        {
            Control zerothControl = this.ControlToDebug.Controls[0];
            DebugControlItem controlDebugBag =
              DebugControlInjection.GetDebugControlItem(this.ControlToDebug);

            if (controlDebugBag != null && zerothControl != null)
            {
                RenderDebugSpot(writer, zerothControl);
                RenderDebugPane(writer, controlDebugBag);
            }
        }
    }
Rendering the Debug Spot
One of the bigger challenges was overlaying the Debug Spot at the top left corner of the user control because I didn't want to mix the debug HTML with the content HTML, and user controls do not inherently have an HTML boundary to use for runtime absolute positioning. User controls do, however, almost always contain one of three things: all server controls, all HTML tags, or a mixture of both.
I used the ClientID of the first control within each user control, to get the co-ordinates at runtime, and using JavaScript, positioned the Debug Spot. Here is an example of a rendered debug spot; note that ctl04debugSpot is the client-side ID of the Debug Spot, ctl04 is the client-side ID of the debug pane, and ucHeader_pnlHeader is the client-side ID of the first control within the Header user control.
<div class="debugSpot" id="ctl04debugSpot"
     onclick="showDebug(this, 'ctl04');"></div>
<script>
  setPosition(getControl('ctl04debugSpot'), getControl('ucHeader_pnlHeader'));
</script>
This works great when the first control is a server control and actually has an ID; if not, this isn't going to work, but if you scroll upwards to the AddDebugControl method, you'll see I am calling EnsureClientID which will do one of two things based on whether the first control is a server control or HTML output (which becomes a LiteralControl). For server controls, a unique ID is generated if none has been assigned (remember that ClientID is automatically generated out of ID).
Client-side IDs for LiteralControls require more work as we are dealing with raw HTML which may or may not already have a client-side ID (which, confusingly, is ID in HTML). For this, I used a Regular Expression and set the LiteralControl's ID to the HTML ID if it already exists; otherwise, a unique ID is generated. All this looks like:
private static readonly Regex TagIdRegex =
new Regex("[^<]*?<.*?\bid\b[ ]?=[ ]?[\\\"']?([^ \\\"']*)",
RegexOptions.Singleline | RegexOptions.IgnoreCase);
private static void EnsureClientID(UserControl uc)
{
LiteralControl lit = uc.Controls[0] as LiteralControl;
if (lit != null)
{
Match m = TagIdRegex.Match(lit.Text);
string id = m.Groups.Count != 0 ? m.Groups[1].Value : null;
if (string.IsNullOrEmpty(id))
{
id = GenerateDebugId();
int pos = lit.Text.IndexOf('>');
lit.Text = string.Format("{0} id=\"{2}\" {1}", lit.Text.Substring(0, pos),
lit.Text.Substring(pos), id); lit.ID = id; } else { uc.Controls[0].ID = id;
}
}
else if (string.IsNullOrEmpty(uc.Controls[0].ID))
{
uc.Controls[0].ID = GenerateDebugId();
}
}
private static string GenerateDebugId()
{
return "debug_" + Guid.NewGuid().ToString("N");
}
The only other thing to note is that LiteralControls do not generate ClientIDs automatically (as they have no meaning because the ID is output within the HTML), so I put in an extra check for it:
public static string GetClientID(Control control)
{
  return control is LiteralControl ? control.ID : control.ClientID;
}
Conclusion
What started as a simple set of objectives turned out to be a lot more challenging than I had originally anticipated. Firstly, there was the Debug Spot positioning issue, then there was the lack of an ID to position the spot against. Using HttpModules allows for great code reuse, and simplifies the logic within the website itself, and this implementation also satisfied the two other objectives: don't mix content and debug information either visually or within the HTML source.
Please keep in mind that this code is only a prototype, and has never been implemented or tested in a production website (yet).
As with most things, there is still room for improvement, the DebugModule needs configuration, if nothing else than for the URLs to the debug js and css files, and it would be nice if it was possible to configure the module to use a custom DebugPaneControl instead of the default one.
Finally, a small improvement would be to output domain-specific debug information; a banner, for example, should show its name or ID, and this could be achieved by adding an item to the DebugPropertyBag after the LoadComplete event, but before the Render stage (PreRender would be the ideal time); all the code is in place within the DebugModule, but I just didn't get a chance to code the website bit - let me know how you get on.
History
- Version 1.0 - Initial release.
Hi, my name's Andy Wilson and I live in Cambridge, UK where I work as a Senior C# Software Developer.


 General
  News
News  Suggestion
  Question
  Bug
Bug  Answer
  Joke
Joke  Praise
  Rant
Rant  Admin
Admin 


