The application can be accessed
here
screenshot gallery
Introduction
In 2002, I created my first Mandelbrot plotter after reading this footnote in James Gleick's Chaos: Making a New Science (Viking Penguin Inc, 1987).
| A Mandelbrot set program needs just a few essential pieces. The main engine is a loop of instructions that takes its starting complex number and applies the arithmetical rule to it. For the Mandelbrot set, the rule is this: Z→Z2+C, where Z begins at zero and C is the complex number corresponding to the point being tested. [...] To break out of this loop, the program needs to watch the running total. If the total heads off to infinity, moving farther and farther from the center of the plane, the original point does not belong to the set, and if the running total becomes greater than 2 or smaller than -2 in either its real or imaginary part, it is surely heading off to infinity—the program can move on. But if the program repeats the calculation many times without becoming greater than 2, then the point is part of the set. [...] The program must repeat this process for each of thousands of points on a grid, with a scale that can be adjusted for greater magnification. And the program must display its result. (pg. 231)
|
This seemed simple enough that I thought I could write such a program; I was excited. I decided to write a plotter using C++ and an hour later, I was looking at fractals. Fast forward 10 years and here I am, at it again. I'd been looking for a project that I could use to learn HTML5 and jQuery and, after reading a little bit about how the canvas tag works, I realized that a new Mandelbrot plotter would serve that purpose nicely.
In this article, I aim to cover the details of that program. I don't plan to explain the basics of HTML5 or jQuery UI and I certainly don't plan to cover advanced complex analysis or dynamics. That said, such expertise is not required in order to understand the design and function of this program. You'll simply need to have some knowledge of HTML5, JavaScript, and some college-level algebra.
Math: not so complex
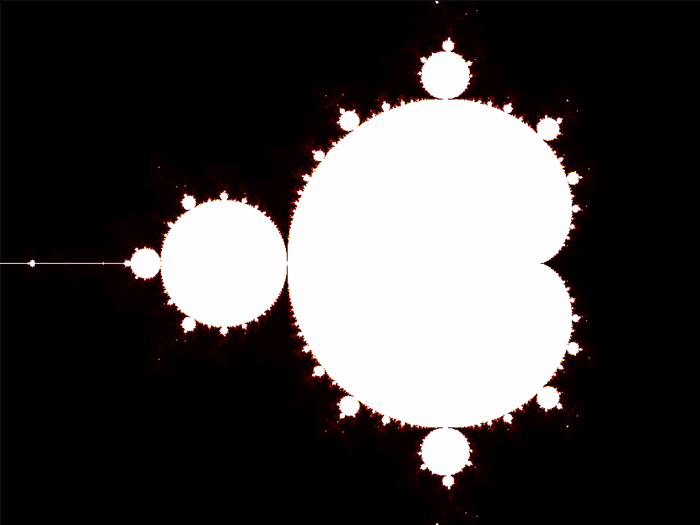
The Mandelbrot set is a complex set that has a fractal boundary, images of which are famous for their beauty and infinite detail. A complex set is a set composed of complex numbers. A complex number is any number of the form a+bi where a and b are real numbers and i is the imaginary unit defined as i=√-1. Subsequently, a is called the real component and bi the imaginary component. Complex variables are often written in boldfaced, capital letters (e.g. Z, C) to distinguish them from normal variables. The iterated function Z→Z2+C is repeatedly applied to each complex point C as described in the above footnote. If either the real or imaginary component of the resulting complex number is ever greater than 2, then we know that the original point C is not part of the set. In order to graph the set, the real components of these complex numbers are plotted along the x-axis and the imaginary along the y-axis. To perform the calculations, the function must be split into its real and imaginary components as follows:
Z→Z2+C
(a+bi)→(a+bi)2+(a0+b0i)
(a+bi)→(a+bi)(a+bi)+(a0+b0i)
(a+bi)→(a2+2abi+bi2)+(a0+b0i)
(a+bi)→a2+2abi-b2+a0+b0i
(a+bi)→(a2-b2+a0)+(2ab+b0)i
an = an-12-bn-12+a0
bn = 2an-1bn-1+b0
The resulting recurrence equations for an and bn give explicit functions for calculating the n'th iteration for a point based on the previous value for the point and the point itself.
Plotter: from math to code
The primary component of the program is the plotter; everything else exists only to support it and its function. The heart of the plotter is the canvas element. The canvas is first sized so as to allow room for all the elements of the UI and then forced to a 4:3 ratio. (note: there is no reason for this other than the author's preference)
width = $(document).innerWidth()-$("#ERightPanel").width()-50;
height = $(document).innerHeight()-$("#EMainDisplay").position().top-157;
if(width*(3/4)<height)
height = Math.round(width*(3/4));
else
width = Math.round(height*(4/3));
xCenter = Math.round(width/2);
yCenter = Math.round(height/2);
iPix = height*width;
In addition to the canvas, the plotter also uses three JavaScript arrays: two value arrays—aiX and aiY—for the real and imaginary components and an active flag array. All of the arrays are sized the same as the canvas, so there is a one-to-one correspondence between indexes of the various arrays. All points begin with a 0 value in both value arrays and are flagged as true in the active array.
for(var i=0;i<iPix; ++i)
{
  afActive[i] = true;
  aiX[i] = 0;
  aiY[i] = 0;
  surface.data[i*4] = 0;
  surface.data[i*4+1] = 0;
  surface.data[i*4+2] = 0;
  surface.data[i*4+3] = 255;
}
The real and imaginary components of the value for each point are computed separately according to the functions described above and stored in their respective value arrays. Since the component functions rely on the component values of the original point, it is not possible to simply traverse the arrays in a linear fashion—the (x, y) coordinates of the current point (a0, b0) must be known. To calculate the needed components, some simple residue arithmetic using the current array index, i, is used.
a0 = i%width
b0 = Math.Floor(i/width)
Translation of the plot is achieved by altering the original point C by adding an offset term like this:
a0 = (i%width-xOff)
b0 = (Math.Floor(i/width)-yOff)
Magnification of the plot is achieved in a similar manner by multiplying by a scaling factor like this (where fMag ≤ 1):
a0 = (i%width-xOff)*fMag
b0 = (Math.Floor(i/width)-yOff)*fMag
For each index traversed in the array, the plot moves an fMag'th of a point offset from the origin. The final computation of the plot, incorporating the above into the recurrence equations, looks like this:
var x = aiX[i];
var y = aiY[i];
aiX[i] = x*x-y*y+(i%width-xOff)*fMag
aiY[i] = 2*x*y+(Math.Floor(i/width)-yOff)*fMag
Armed with this computation, the plotter can traverse the value arrays, applying the arithmetical rule to each point as described in the footnote. After initializing the display, a JavaScript interval is set to call the frame() function and update the display.
t = setInterval(frame, 1);
function frame()
{
  if(!colorMan.bActive)
    return;

  var p;
  if(beginColorCycle)
    colorMan.inc(colorFunc);
  var r = colorMan.comp(0);
  var g = colorMan.comp(1);
  var b = colorMan.comp(2);

  for(var i=0; i<iPix; ++i)
  {
    if(!afActive[i])
      continue;
    var x = aiX[i];
    var y = aiY[i];
    aiX[i]=x*x-y*y+(((i%width)-xOff)*fMag);
    aiY[i]=2*x*y+((Math.floor(i/width)-yOff)*fMag);

    if(aiX[i] >= 2 || aiY[i] >= 2)
    {
      afActive[i] = false;
      beginColorCycle = true;
      continue;
    }
    if(!beginColorCycle)
      continue;
    p = i*4;
    surface.data[p] = r;
    surface.data[p+1] = g;
    surface.data[p+2] = b;
  }
  context.putImageData(surface, 0, 0);
}
If the value of either component is greater than or equal to 2, the point is flagged as false in the active array. The plotter takes an early-out approach, skipping the point immediately if it is not active. If, after its value is updated, the point is still active, its color is then incremented. The plotter does this once for each point in the plot and then repeats the process.
Colorizing of the pixels is handled by an object delBrot, named such since it controls the color gradient of the plot. This approach allows a great deal of flexibility in handling multiple colorizing schemes since the color data is maintained internally. Because it is the color manager, the object instance is named colorMan and, when combined with the object name, this of course results in a colorMandelBrot.
UI: controlling the chaos
The user interface of this program relies heavily upon jQuery UI. All of the jQuery UI widgets used in the program are virtually unaltered versions of the demos at jqueryui.com [link]. In typical jQuery fashion, they are all initialized in the $(document).ready() handler.
The primary component is an animated accordion [link]. Its purpose is to hide information until requested. The specific directions pertaining to the various sections of the program are hidden until that section is activated. This prevents the user from being overwhelmed by a screen full of text. This also allows for very thorough instructions to be written without worry as to the total amount of text. When the accordion's state changes, the handler checks which section is active and either shows or hides pieces of the UI as they gain or lose focus.
$("#EControls").accordion
({
autoHeight: false,
change: function(event, ui)
{
var active = $("#EControls").accordion("option", "active");
if(active == 3)
{
if(!$("#EImageGallery").is(":visible"))
$("#EImageGallery").show("drop", null, 500);
}
else
if($("#EImageGallery").is(":visible"))
$("#EImageGallery").hide("drop", null, 500);
if(active == 1)
{
if(!$("#ERightPanelLower").is(":visible"))
{
loadCoord();
$("#ERightPanelLower").show("drop", {direction: "right"}, 500);
}
}
else
if($("#ERightPanelLower").is(":visible"))
$("#ERightPanelLower").hide("drop", {direction: "right"}, 500);
}
});
Another important component is the animated slider. This component is used for the saved coordinate picker as well as the image gallery. Here, the interface uses motion to indicate relevance (i.e. "Hey, that thing's moving—it must be related to the thing I just clicked."). This is important because several of the UI elements are placed outside the main accordion component to reduce clutter and keep the accordion’s size consistent. This means that related elements are displayed in different areas of the screen, and so there is a risk of the user not realizing that they are meant to be used together. Animating the separated components when they become relevant should help the user make that association.
The plot can be controlled via the mouse by following the instructions in the first section of the accordion. The Plot controls section contains additional controls over the translation and zoom of the plot. These controls are all implemented as adjustments to the plot parameters. Plot translation is acheived by adjusting the plot offset by the vector <center - clicked point>.
$("#EMainDisplay").mousedown(function(e)
{
  var left = e.pageX-$("#EMainDisplay").offset().left;
  var top = e.pageY-$("#EMainDisplay").offset().top;

  switch(e.which)
  {
  case 1:
    xOff += xCenter-left;
    yOff += yCenter-top;
    break;
  case 3:
    var f = $("#EFactor").val();
    if(e.shiftKey)
      f=1/f;
    fMag /= f;
    xOff = xCenter-(left-xOff)*f;
    yOff = yCenter-(top-yOff)*f;
    break;
  }
  initDisplay();
});
Zoom is controlled in a similar manner, by multiplying or dividing the plot scaling factor by the zoom factor.
The dynamic range option in the Render controls section is enabled by default and increases the visible detail of the plot. At higher magnifications, it can take many iterations before pixels begin to get flagged out of set. Without dynamic range enabled, the plot would immediately begin to increment the color values of pixels, wasting the available colors on an essentially blank image. Dynamic range supresses colorization until the first pixel is flagged out of set.
$("#EDRange").is(":checked") ? beginColorCycle = false : beginColorCycle = true;

function frame()
{
...
  if(aiX[i] >= 2 || aiY[i] >= 2)
  {
    afActive[i] = false;
    beginColorCycle = true;
    continue;
  }
  if(!beginColorCycle)
    continue;
...
}
All of the colorization schemes are handled by delBrot. The default colorization mode increments a single color component from 0-255 before moving to the next color, starting with red, then green, and then blue. Once all the color components are at maximum value (pure white), delBrot disables itself.
function(mode)
{
switch(mode)
{
case 0:
case 1:
if(!this.bActive)
return;
if(aiComponents[0]<255)
aiComponents[0]++;
else
{
if(aiComponents[1]<255)
aiComponents[1]++;
else
{
if(aiComponents[2]<255)
aiComponents[2]++
else
{
if(mode==0)
this.bActive = false;
else
{
aiComponents[0]=0;
aiComponents[1]=0;
aiComponents[2]=0;
}
}
}
}
break;
case 2:
if(!this.bActive)
return;
if(bForward)
if(aiComponents[0]<255)
aiComponents[0]++;
else
{
if(aiComponents[1]<255)
aiComponents[1]++;
else
{
if(aiComponents[2]<255)
aiComponents[2]++
else
{
bForward = false;
}
}
}
else
if(aiComponents[2]>0)
aiComponents[2]--;
else
{
if(aiComponents[1]>0)
aiComponents[1]--;
else
{
if(aiComponents[0]>0)
aiComponents[0]--;
else
bForward = true;
}
}
break;
}
};
The color cycling mode functions the same as the default mode except that it resets the current color to black upon reaching the end. Color oscillation increments the individual color channels in the same manner as the other modes except that once it's reached the end it begins to decrement the color, causing the active pixels to oscillate between black and white.
HTML5's localStorage object allows for plot settings as well as images to be saved locally. Two master entries are used—plots and shots—to store the names of the entries containing the actual plot and image data. Since web storage only works with text, image data is first converted to base-64 encoded text using the canvas's toDataURL() method. Unfortunately, web storage is typically very limited and uncompressed image data consumes a lot of space, so local storage of image data is usually limited to 3–6 pictures.
Closing
I have been very pleased with the way this project turned out. My intention was to learn HTML5 and jQuery, and this project allowed me to do just that. I personally find it extra rewarding that, in this version, I was able to implement some features that I never got around to implementing in my previous version, such as improved color controls and the ability to take screenshots. Of course, as with the previous version, this time I am again leaving behind some unfinished ideas (to be implemented perhaps in another 10 years or so). There are, for example, a handful of bugs of which I'm aware; I have some ideas for user-defined color schemes; and I'd really like to add some parallelism using web workers. As it is, even without parallel processing, this version is not much slower than my old C++ version (and the enhanced image quality and UI features more than make up for the difference). If I write another version, the next one will likely be in assembly. I'd be curious to do a side-by-side speed test and, also, I'd like to write a version that allows for arbitrarily small real numbers (limited by computer memory, of course). The current version can reach a magnification factor of only 1016 due to loss of precision, so I'd like to create a version in assembly that can handle even tinier numbers to see how far down the rabbit hole really goes. For the time being, however, I think I'm going to call this one “done”—again.
Thanks for reading, and I hope you enjoy using the program as much as I enjoyed making it!

This member has not yet provided a Biography. Assume it's interesting and varied, and probably something to do with programming.


 General
  News
News  Suggestion
  Question
  Bug
Bug  Answer
  Joke
Joke  Praise
  Rant
Rant  Admin
Admin 


