Introduction
This article gives a method for using Excel VBA to convert discrete data points into a histogram. It utilizes user forms within VBA to retrieve data either from a worksheet in Excel itself, or from a text file stored separately.
Background
In many engineering fields there is often a great deal of test data gathered from various systems. This data can be pressure, temperature, voltage, current, speed, or whatever other type of data needs to be gathered. Typically, the test equipment used to gather and store this data keeps track of every data point as a set of discrete points at specific times. This type of data is often called time-history data, since it shows a time-based history of the data being collected. The scrolling line on the performance monitor on your PC is an example of this type of data.
In many cases, however, this time-history type of data is not very useful for mathematical or engineering analysis. That is where the histogram comes into play. The time-history data can be converted into what is often know as time-at-level data, or a histogram.
A histogram displays the number of times that the data being examined falls within a specified range. Typically a number of ranges, or bins, are used so that the entire range of data can be represented.
Like most engineers, I had a need to turn time-history data into time-at-level data, so the solution was to create an Excel Add-In to help automate this task. There are many pieces of commercial software available that will do this task quickly and efficiently, but I had no budget for these, and Excel was available.
I developed this solution a few years ago, and decided to make it into a Code Project article in response to this question on StackOverflow.
Using the code
The majority of the code in this project is the user interface to get Excel to help the user select the data to be converted and to specify how the data should be divided. The actual mechanics of creating the userform and programming the controls on it is not the main subject of this article.
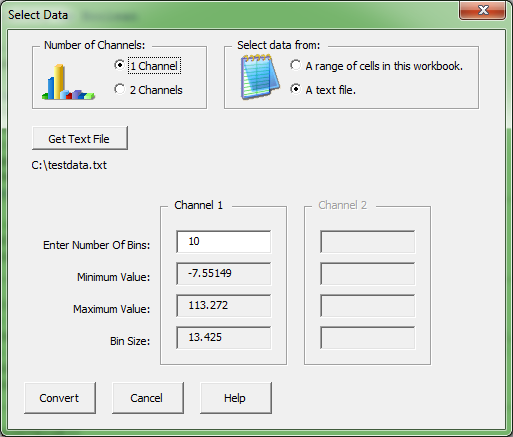
The above user form allows the user to select a number of options:
- either 1-channel or 2-channel data conversion
- the data source, either a text file or a range of cells on a worksheet
- the number of bins the data should be sorted into
After the user selects the data, the minimum and maximum values are found. The user can then enter the number of bins to sort the data into. After number of bins is entered, the bin size is calculated and displayed.
The key piece of information to convey is the code to actually turn the time-history data into time-at-level data.
The PutDataInBins() method is used for that function, and the following code excerpt is where the actual conversion occurs:
For RowNumber = 0 To NumberOfDataLines - 1
BinNumber0 = Int((DataValueList(RowNumber, 0) - MinimumValue(0)) / BinSize(0))
If chanDimension = 2 Then
BinNumber1 = Int((DataValueList(RowNumber, 1) - MinimumValue(1)) / BinSize(1))
Else
BinNumber1 = 0
End If
BinCount(BinNumber0, BinNumber1) = BinCount(BinNumber0, BinNumber1) + 1
Next
The key calculation to make the conversion is only one line of code:
BinNumber0 = Int((DataValueList(RowNumber, 0) - MinimumValue(0)) / BinSize(0))
BinNumber0 represents the number of the bin to place the current data point. DataValueList is the value of the current data point. MinimumValue represents the minimum vale for all data points in that channel, and BinSize is the calculated size of each bin. These calculations determine what bin number should have a count added to it for this data point.
The example shown in the user form screenshot above uses the sample data file, testdata.txt, that is part of the zip file download. This is one channel of data saved as time-history data, or sequential data points. Shown below is a graphical representation of these 10000 data points:

The add-in then converts the data into time-at-level, or histogram format, with the data being placed in 10 discrete bins. Shown below is the output and a chart created from the output data:
The add-in can be used as-is or modified to automate the chart creation process for the 1-channel conversion.
Points of Interest
Excel VBA is filled with all kinds of pitfalls and watch-outs, but this project is straightforward enough that it doesn't encounter any of the more serious issues.
Keep in mind, that unless you explicitly tell VBA differently, all arrays and collections are 1-based rather than 0-based. Even if you declare arrays to be 0-based, the built-in Excel collection objects are still 1-based.
Employed as a hydraulic systems design engineer. I develop tools in VB.NET and C# to support this function.


 General
  News
News  Suggestion
  Question
  Bug
Bug  Answer
  Joke
Joke  Praise
  Rant
Rant  Admin
Admin 


