Introduction
Do
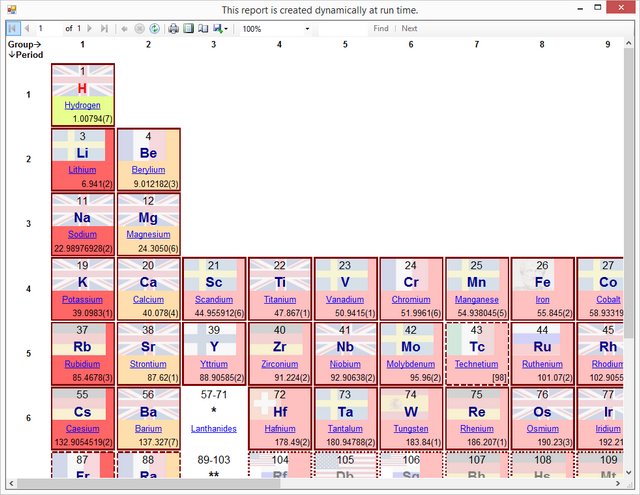
your reports have tons of variations that you don’t think it’s a good idea to
statically design all of them at design time? Then, this article might help you
generating the reports dynamically – i.e., not designing *.rdlc files at design
time. The above screenshot is a sample report that I created dynamically for
this article – a periodic table that features hyperlinks and embedded images.
You
can download the source code written in C# and developed in Visual Studio 2013.
Background
In
a recent software project, I had a requirement where as many as 100 tables and
charts needed to be reported based on conditions the user determines. In some
scenarios, the user wants tables 1, 3, 54, and 88, together with the charts
12, 13, and 55. In others, the report should show the tables 2 and 4 with no
charts, and so on. The number of combinations were huge, if not infinite.
I
Googled for articles on generating RDLC dynamically, but there
didn't seem to be much information. What Microsoft offers in http://technet.microsoft.com/en-us/library/ms170239(v=sql.105).aspx
is too crude to use as a basis for generating my own specific reports. Simply
put, the GenerateRdl() function is just bad, monolithic code without any
structure and uses lots of string literals.
So
I embarked on creating a set of classes myself so I can code something like
this – if the user wants the tables 1, 3, 54, and 88, then I would add those
tables to the report by using C#’s control flow statements such as "if" and
"switch".
Using the Code
Now,
let’s look at the Form class code that shows the report generator filled with
the periodic table:
namespace PeriodicTable
{
    using System.Windows.Forms;
    using Microsoft.Reporting.WinForms;
    public partial class Form1 : Form
    {
        public Form1()
        {
            this.InitializeComponent();
        }
        private void Form1_Load(object sender, System.EventArgs e)
        {
            var rv = new ReportViewer { Dock = DockStyle.Fill };
            this.Controls.Add(rv);
            new PeriodicTableReportGenerator(rv.LocalReport).Run();
            rv.RefreshReport();
        }
    }
}
Form1_Load()
function instantiates a ReportViewer, puts it in the Controls,
passes its LocalReport to the PeriodicTableReportGenerator constructor,
and then calls the Run() method.
PeriodicTableReportGenerator
Generates the RDLC dynamically and sets up the
LocalReport.
Finally
Form1 calls
RefreshReport() to show the
periodic table.
Below
is the code of PeriodicTableReportGenerator:
namespace PeriodicTable
{
    using Microsoft.Reporting.WinForms;
    using PeriodicTable.Properties;
    using PeriodicTable.Report.Rdl;
    public class PeriodicTableReportGenerator : ReportGenerator
    {
        public PeriodicTableReportGenerator(LocalReport localReport)
            : base(localReport)
        {
        }
        public override void Run()
        {
            var dataSetForMainTable = CreateDataSet();
            var mainTable = MainTable.Create(dataSetForMainTable.Name);
            var dataSetForSubTable = CreateDataSet();
            var subTable = SubTable.Create(dataSetForSubTable.Name);
            var body = new Body();
            body.AddReportItem(mainTable);
            body.AddReportItem(subTable);
            this.Report.AddReportSection(new ReportSection(body));

            this.Report.AddDataSet(dataSetForMainTable);
            this.Report.AddDataSet(dataSetForSubTable);
            this.DataSources.Add(new ReportDataSource(dataSetForMainTable.Name,
                MainTableDataSource.Create()));
            this.DataSources.Add(new ReportDataSource(dataSetForSubTable.Name,
                SubTableDataSource.Create()));
            this.CreateEmbeddedImages();
            base.Run();
        }
        private static DataSet CreateDataSet()
        {
            var dataSet = new DataSet();
            dataSet.AddField(ElementProperty.Group);
            dataSet.AddField(ElementProperty.Period);
            dataSet.AddField(ElementProperty.Name);
            dataSet.AddField(ElementProperty.AtomicNumber);
            dataSet.AddField(ElementProperty.ChemicalSymbol);
            dataSet.AddField(ElementProperty.RelativeAtomicMass);
            dataSet.AddField(ElementProperty.MassUncertainty);
            dataSet.AddField(ElementProperty.ChemicalProperty);
            dataSet.AddField(ElementProperty.NaturalOccurrence);
            dataSet.AddField(ElementProperty.CountryOfDiscovery);
            dataSet.AddField(ElementProperty.State);
            dataSet.AddField(ElementProperty.Url);
            return dataSet;
        }
        private void CreateEmbeddedImages()
        {
            this.Report.AddEmbeddedImage(
                new EmbeddedImage(Resources.NoBackground,
                CountryOfDiscovery.Undiscovered.ToString()));
            this.Report.AddEmbeddedImage(
                new EmbeddedImage(Resources.Aristotle,
                CountryOfDiscovery.KnownToAncients.ToString()));
            …
        }
    }
}
The
Run() method creates two DataSet - one for the MainTable
that shows the main periodic table without the Lanthanides and Actinides, and
the other for the SubTable that shows them just below the main
table as is normally the case. This DataSet just defines the name
of the data fields in string and is completely different from the class with
the same name in ADO.NET. Because I didn’t want to use string literals to
represent the properties in the collection, I resorted to reflection to get
them. The ElementProperty Class does that.
The
main table’s RDLC is then created by calling MainTable.Create()
static method that returns a ReportItem. The second table is
created in the same way.
Then,
it instantiates a Body and adds the generated main and sub tables
to it. Here, if the user does not want to see the Lanthanides and Actinides,
then I could just skip adding the sub table. This is the freedom I wanted in my
project. The body is enclosed with a ReportSection and is then
added to the Report that is instantiated in its base class - ReportGenerator.
Next,
we add the two DataSet to the Report. Then we generate
the data themselves – i.e., the physical elements data that belong to the main
table and those for Lanthanides and Actinides. We assign the data set name for
each table and add the data source to DataSources. As you can see
in the screenshot, the periodic table features a dimmed national flag that
represents the country of the scientist or the team of scientists that first
discovered the element. So, we create the images and add them to the Report
as well.
Finally,
the Run() function calls its base.Run() method.
That’s it.
Report Design
Statically
designing the same report is of course not difficult. The following figure
shows the design of the periodic table as the Visual Studio’s Report Designer
renders it:

As
you can see, there are two tables – the upper left one is that for the main
table and the lower right for the second. Note that even if the periodic table
has a total of 18 columns, the design surface does not have 18 columns in the
table. Instead, it has just one. Likewise, even if the periodic table has a
total of 7 rows, there is only a single row in the design. Adding columns and
rows dynamically, driven by the data, is the job of the report engine. So, one
of our most important jobs in designing a report is to comprehend "what" should
be repeated in both column and row directions. Once we understand what is
repeating, we can identify the so-called "group expression" that determines
what data are grouped together.
In
RDLC, the tables are called Tablix – a synthesized word by
combining table and matrix. Just for your reference, I included Report1.rdlc
file that I statically designed by using the report designer to make the same
periodic table. You can compare the results of the dynamic and static RDLC
generations by changing the startup form from Form1 to Form2 in Program.cs.
Just
for your information, Form2’s load event looks like this:
private void Form2_Load(object sender, EventArgs e)
{
    var rv = new ReportViewer { Dock = DockStyle.Fill };
    rv.LocalReport.ReportEmbeddedResource = "PeriodicTable.Report.Report1.rdlc";
    this.Controls.Add(rv);
    rv.LocalReport.DataSources.Add(
        new ReportDataSource("DataSet1", MainTableDataSource.Create()));
    rv.LocalReport.DataSources.Add(
        new ReportDataSource("DataSet2", SubTableDataSource.Create()));
    rv.RefreshReport();
}
The
statically designed RDLC file is assigned to the LocalReport.ReportEmbeddedResource.
Exactly the same data sources are added to the report viewer.
Our
PeriodicTableReportGenerator generates this same RDLC dynamically.
Dynamically creating a Tablix
Now,
before diving deep into the sea of RDLC, we need to make ourselves familiar to
some terminology. The upper left corner of the table is called TablixCorner.
In the main periodic table, I show "Groupà" and "âPeriod"
as string constants in the cell’s Textbox.
The
upper right corner that represents the table’s column hierarchy is called TablixColumnHierarchy,
which is where we put a group expression so that columns can be added horizontally,
driven by the data, in addition to showing the group number text string. In the
main table, a column represents the "group" of the element, ranging from 1 to
18. Because the group number must change dynamically, I cannot use a string
constant as I did for the TablixCorner. Instead we have to use
"expression" so the report engine can dynamically evaluate it. The simplest
expression is just a field of a DataSet. This is exactly the case
for this cell and the design surface shows "[Group]" for the cell value, which
means that the report engine takes the field of "Group" from the data and
convert it to a string dynamically. Expression of this simplest form is
presented as the field name enclosed by angle brackets by the report designer.
The
lower left corner that represents the table’s row hierarchy is called TablixRowHierarchy
in which we specify another group expression so that rows can be added
vertically, driven by the data, in addition to showing the period number text
string. Again, the text is the simplest expression – "[Period]".
The
lower right corner – the entire rectangle enclosed in maroon – is called TablixBody,
which is the meat of the periodic table and represents the details of each
element. In designing it, I tried to mimic one from Wikipedia - http://en.wikipedia.org/wiki/Periodic_table_(large_version),
including the cell background color and frame style. I also added a background
image to show the country of origin.
Now,
unlike the other three cells in the main table’s Tablix, we have
to put a lot more information in the TablixBody cell – atomic
number, chemical symbol, name of the element with a hyperlink, and relative
atomic mass with possible uncertainty. So, instead of putting a single Textbox,
I put in the cell a Rectangle in which another Tablix
that has four rows in itself is placed.
Finally,
we are ready to look at the code that generates the main table’s Tablix:
namespace PeriodicTable
{
using PeriodicTable.Report.Rdl;
public class MainTable
{
public static ReportItem Create(string dataSetName)
{
return new Tablix(
CreateTablixCorner(),
CreateTablixColumnHierarchy(),
CreateTablixRowHierarchy(),
CreateTablixBody(dataSetName),
dataSetName);
}
private static TablixCorner CreateTablixCorner()
{
var textRuns1 = new TextRuns(new TextRun
{ Value = "Group", FontWeight = FontWeight.Bold });
textRuns1.Add(new TextRun { Value = "", FontFamily = "Wingdings" });
var textRuns2 = new TextRuns(new TextRun
{ Value = "", FontFamily = "Wingdings" });
textRuns2.Add(new TextRun
{ Value = "Period", FontWeight = FontWeight.Bold });
var textbox = new Textbox(new Paragraph(textRuns1))
{ TextboxStyle = new TextboxStyle() };
textbox.AddParagraph(new Paragraph(textRuns2));
return
new TablixCorner(
new TablixCornerRows(
new TablixCornerRow(
new TablixCornerCell(new CellContents(textbox)))));
}
private static TablixColumnHierarchy CreateTablixColumnHierarchy()
{
var group =
new Group(
new GroupExpressions(
new GroupExpression(
"=" + Expression.FieldsValue(ElementProperty.Group))));
var sortExpression =
new SortExpression(new Value(
"=" + Expression.FieldsValue(ElementProperty.Group)));
var sortExpressions = new SortExpressions(sortExpression);
var textRun = new TextRun
{
Value = "=" + Expression.FieldsValue(ElementProperty.Group),
FontWeight = FontWeight.Bold
};
var paragraph = new Paragraph(new TextRuns(textRun))
{ TextAlign = TextAlign.Center };
var textbox = new Textbox(paragraph)
{ TextboxStyle = new TextboxStyle() };
var header = new TablixHeader(new Inch(0.4), new CellContents(textbox));
return new TablixColumnHierarchy(
new TablixMembers(
new TablixMember(group, sortExpressions, header)));
}
private static TablixRowHierarchy CreateTablixRowHierarchy()
{
var group =
new Group(
new GroupExpressions(
new GroupExpression(
"=" + Expression.FieldsValue(ElementProperty.Period))));
var sortExpression =
new SortExpression(
new Value(
"=" + Expression.FieldsValue(ElementProperty.Period)));
var sortExpressions = new SortExpressions(sortExpression);
var textRun = new TextRun
{
Value = "=" + Expression.FieldsValue(ElementProperty.Period),
FontWeight = FontWeight.Bold
};
var paragraph = new Paragraph(new TextRuns(textRun))
{ TextAlign = TextAlign.Center };
var textbox = new Textbox(paragraph)
{
TextboxStyle = new TextboxStyle
{ VerticalAlign = VerticalAlign.Middle }
};
var header = new TablixHeader(new Inch(0.7), new CellContents(textbox));
return new TablixRowHierarchy(
new TablixMembers(new TablixMember(group, sortExpressions, header)));
}
private static TablixBody CreateTablixBody(string dataSetName)
{
var rectangle = new Rectangle();
rectangle.AddReportItem(ElementCell.Create(dataSetName));
var tablixColumns = new TablixColumns(
new TablixColumn(new Width(new Inch(1.05))));
var tablixCells = new TablixCells(
new TablixCell(new CellContents(rectangle)));
var tablixRows = new TablixRows(
new TablixRow(new Inch(0.85), tablixCells));
return new TablixBody(tablixColumns, tablixRows);
}
}
}
The
static Create() method just instantiates a Tablix and
returns it as a ReportItem. As you may have imagined, a Tablix
<is a> ReportItem. As I explained in the previous section, a
Tablix is made of four parts. It also needs to know the data set
name that it will work on. As a result, the constructor has five parameters.
Creating TablixCorner
The
CreateTablixCorner() method creates a TablixCorner,
where I have to add the text constants - "Groupà" and "âPeriod"
separated by a new line in a Textbox. A TextRun
represents a "text run" that shares the same font parameters. The Report
Viewer’s default font is Arial with 10pt font size. If you do not specify the
font parameters in TextRun, it will use the default font. Since I
wanted to show "Group" in bold face, I specified it as shown below:
var textRuns1 = new TextRuns(
    new TextRun { Value = "Group", FontWeight = FontWeight.Bold });
This
is how you specify a text run and add it to TextRuns, which is a
collection of TextRun.
Now,
the left arrow character is in Windings font. So, I need to create another TextRun
and add it to the same TextRuns:
textRuns1.Add(new TextRun { Value = "", FontFamily = "Wingdings" });
Next,
I have to add "âPeriod"
in the same text box, but on a new line. This means that I need two Paragraphs
– one with the "Groupà"
text run and the other with the "âPeriod"
text run. The Textbox will then be complete:
var textbox = new Textbox(new Paragraph(textRuns1));
textbox.AddParagraph(new Paragraph(textRuns2));
Finally,
the function instantiates a TablixCorner with the Textbox
as its CellContents and returns it.
Creating TablixColumnHierarchy
The
CreateTablixColumnHierarchy() method creates a TablixColumnHierarchy,
where I have to add the group and sort expressions together with the text that
represents the "group" of the element. If you get confused with the two usages
of the term "group", the onus is on me in having chosen an example that has the
same term in business domain. The two expressions are created in a similar way:
var group = new Group(
    new GroupExpressions(
        new GroupExpression("=" + Expression.FieldsValue(ElementProperty.Group))));

var sortExpression = new SortExpression(
    new Value("=" + Expression.FieldsValue(ElementProperty.Group)));
var sortExpressions = new SortExpressions(sortExpression);
We
are grouping each element by using its Group property – i.e., Group 1 elements,
Group 2 elements, up to Group 18 elements. The sort expression is also the
group number because we want to order the elements in its ascending order. If
we do not add the sort expression, then the Report Viewer will place the
elements as it appears in the data source.
Now,
let’s talk about the expressions. Expressions in RDLC always start with an
equal sign. The simplest expression is, as I mentioned earlier, the data set’s
field value and should look like this:
=Fields!AtomicNumber.Value
You
could put an expression by using string literals like this:
var group = new Group(
    new GroupExpressions(new GroupExpression("=Fields!Group.Value")));
But
I wanted to avoid it because I always make typos and string literals cannot be
checked by the compiler. If the Report Viewer finds anything wrong with the
supplied RDLC, it shows an error message on the screen when its RefreshReport()
method is called:
When
you see one of those, you will have to debug your RDLC generation. I added a
debug statement in the Run() method of the ReportGenerator
class:
public virtual void Run()
{
this.LoadReportDefinition();
}
By
uncommenting the first statement, you would be able to see the entire RDLC in
Visual Studio’s Output window in debug mode.
Finally,
we create a TablixHeader in which we place the row header text
that is also an expression:
var textRun = new TextRun
    {
        Value = "=" + Expression.FieldsValue(ElementProperty.Group),
        FontWeight = FontWeight.Bold
    };
var paragraph = new Paragraph(new TextRuns(textRun))
    { TextAlign = TextAlign.Center };
var textbox = new Textbox(paragraph)
    { TextboxStyle = new TextboxStyle() };
var header = new TablixHeader(new Inch(0.4), new CellContents(textbox));
Note
that TextAlign is an attribute of a Paragraph. I
added TextAlign.Center in order to show the group number in the
center of the cells. The first parameter for the constructor represents the
height of the header row in inch.
Creating TablixRowHierarchy
The
CreateTablixRowHierarchy() method creates a TablixRowHierarchy,
where I have to add the group and sort expressions together with the text that
represents the "period" of the element. TablixRowHierarchy looks
very much like TablixColumnHierarchy. Note that the VerticalAlign
is an attribute of a Textbox. Because I wanted to show the period
number in the middle of the row header cell, I put VerticalAlign.Middle
for the Textbox:
var textbox = new Textbox(paragraph)
    {
        TextboxStyle = new TextboxStyle { VerticalAlign = VerticalAlign.Middle }
    };
var header = new TablixHeader(new Inch(0.7), new CellContents(textbox));
The
first parameter for the constructor represents the width of the header column
in inch:
var header = new TablixHeader(new Inch(0.7), new CellContents(textbox));
Creating TablixBody
At
last, we create the TablixBody. As I said, it’s the meat of the
periodic table. But the method is unexpectedly short. This is because we
delegate creating the contents of the body cell to another class - ElementCell.
We just add the created ReportItem in a Rectangle and
finish creating TablixBody. We specify the body cell’s width in TablixColumn
and height in TablixRow.
Note
that you could put the created ReportItem directly in the CellContents
of the TablixCell without enclosing it first with a Rectangle.
But if you do that, the element’s cells would have no margins between them as
shown below:
By
adding a Rectangle and specifying the Top and Left
properties in the class’s constructor allows us to add the 0.025 inch margin:
public class ElementCell
{
    public static ReportItem Create(string dataSetName)
    {
        return new Tablix(
            CreateTablixColumnHierarchy(),
            CreateTablixRowHierarchy(),
            CreateTablixBody(),
            dataSetName)
        {
            Top = new Inch(0.025),
            Left = new Inch(0.025),
            Style = CreateTablixStyle()
        };
    }
…
Creating RDLC for the second table
The
second table for the Lanthanides and Actinides is very similar to the main
table. The only point of interest is the group expression of the column
hierarchy; we cannot use the simplest "group" expression because all
Lanthanides and Actinides share the same group number which is 3. So, we need
to come up with something that can be used as "group". I noticed the following
fact; if I subtract the atomic number of Lanthanum from all Lanthanides and
that of Actinium form all Actinides, then I will have a new "group" number that
starts with zero for both Lanthanides and Actinides. This is done by using the
following expression:
private static string CreateColumnGroupExpression()
{
    const int LanthanumAtomicNumber = 57;
    const int ActiniumAtomicNumber = 89;
    return "=IIf("
        + Expression.FieldsValue(ElementProperty.ChemicalProperty) + "="
            + (int)ChemicalProperty.Lanthanide + ","
        + Expression.FieldsValue(ElementProperty.AtomicNumber) + "-"
            + LanthanumAtomicNumber + ","
        + Expression.FieldsValue(ElementProperty.AtomicNumber) + "-"
            + ActiniumAtomicNumber + ")";
}
Here,
I use the IIf() function that is available for RDLC expressions. Translating
the expression into plain English would give the following – if the chemical
property is Lanthanide, then subtract 57 from the atomic number, else subtract
89 from the atomic number. The report engine will take that number as the
group.
Creating RDLC for the Element Cell
The
element cell is also made of a Tablix, but it is made of only a
single column with four rows as you can see on the design surface:
The
first row cell shows "[AtomicNumber]" and the second one shows
"[ChemicalSymbol]" in the specified font size and styles. These are just simple
field expressions. The third and fourth rows are much more complex. This is why
the Report Designer shows "<<Expr>>".
The
third row’s text value expression is created by the following function:
private static string CreateHyperLinkExpression()
{
    var result =
        "='<a href=''' & IIf(IsNothing("
        + Expression.FieldsValue(ElementProperty.Url) + "),"
        + "'mailTo:me.com',"
        + Expression.FieldsValue(ElementProperty.Url) + ")"
        + " & '''>' & " + Expression.FieldsValue(ElementProperty.Name) + " & '</a>'";
    return result.ReplaceSingleQuoteWithDoubleQuote();
}
It
is very complex, but basically it creates an HTML to represent the hyper link
that the user can click to see the element’s details in the browser. In plain
English, it means the following – if the URL property is missing, then hyper
link to mailto:me.com, else hyper link to the
specified URL property and shows the Name property with the underline. Here, I
used a single quote instead of double quote in writing the string literal
because I wanted to see the entire string a little easier without the escape
sequence (\") to represent a double quote. The mailto:me.com
is just a place holder for the blank elements that appear in the upper middle
of the main table. Without that, the Report Viewer will show a warning message
while rendering the RDLC in the Output window of the Visual Studio when running
under debug mode. The ReplaceSingleQuoteWithDoubleQuote() method
replaces all single quotes by double quotes.
In
order to let the Report Viewer to recognize it as an HTML, we need to specify MarkupType
as HTML for the TextRun in which the expression belongs to as
shown below:
var textRun = new TextRun
    { Value = CreateHyperLinkExpression(), MarkupType = MarkupType.HTML };
The
fourth row’s text value expression is created by the following function:
private static string CreateRelativeAtomicMassExpression()
{
    var result =
        "=IIf(" + Expression.FieldsValue(ElementProperty.MassUncertainty) + " <> 0,"
        + Expression.FieldsValue(ElementProperty.RelativeAtomicMass) + " & '(' & "
        + Expression.FieldsValue(ElementProperty.MassUncertainty) + " & ')',"
        + "IIf(IsNumeric(" + Expression.FieldsValue(ElementProperty.AtomicNumber)
        + "),"
        + "'[' &" + Expression.FieldsValue(ElementProperty.RelativeAtomicMass)
        + " & ']',''))";
    return result.ReplaceSingleQuoteWithDoubleQuote();
}
It
means the following – if mass uncertainty is not equal to zero, then show the
relative atomic mass followed by the mass uncertainty enclosed by a
parenthesis. Else if the atomic number is numeric, then show the relative
atomic mass enclosed by an angle bracket. Otherwise, show a blank. Molybdenum is
an example of the first case and Technetium is one for the second case:
Since
this Tablix does not have a TablixCorner, the
construction is a little different from that of the main table and sub table.
But I believe that you can relatively easily follow the source code, by now.
Lowest level functions that actually
creates RDLC
So
far, you have seen many class names such as Tablix, TextRuns,
Textbox, and so on, which are used to construct the main table,
sub table, and element cell. How do those lower level classes create the actual
RDLC – i.e., XML code with the predefined names and attributes? Let’s look at the
Textbox to see how XML is generated:
namespace PeriodicTable.Report.Rdl
{
    using System.Xml.Linq;
    public class Textbox : ReportItem
    {
        private static int index;
        private readonly string name;
        private readonly Paragraphs paragraphs = new Paragraphs();
        private readonly string rdlName;
        public Textbox(Paragraph paragraph)
        {
            this.rdlName = typeof(Textbox).GetShortName();
            this.name = this.rdlName + ++index;
            this.AddParagraph(paragraph);
        }
        public TextboxStyle TextboxStyle { get; set; }
        public void AddParagraph(Paragraph paragraph)
        {
            this.paragraphs.Add(paragraph);
        }
        protected override XElement Build()
        {
            var result = new XElement(
                this.rdlName,
                new XAttribute("Name", this.name),
                new XElement("CanGrow", true),
                new XElement("KeepTogether", true),
                this.paragraphs.Element);
            this.ConfigureTextboxStyle(result);
            this.ConfigureTop(result);
            this.ConfigureLeft(result);
            this.ConfigureHeight(result);
            this.ConfigureWidth(result);
            return result;
        }
        private void ConfigureTextboxStyle(XElement textbox)
        {
            if (this.TextboxStyle != null)
            {
                textbox.Add(this.TextboxStyle.Element);
            }
        }
    }
}
I
decided to use the XElement class, rather than the XmlDocument, because Jon
Skeet "thoroughly recommended" the use of it in http://stackoverflow.com/questions/1542073/xdocument-or-xmldocument.
Probably, XmlDocument can do the same, but XElement is newer. And the latest
and greatest is always better, right?
I
will not explain the details of the class, but if you create the Textbox
that is used to create the TablixCorner in the main table, the
following XML code will be generated:
<Textbox Name="Textbox1">
  <CanGrow>true</CanGrow>
  <KeepTogether>true</KeepTogether>
  <Paragraphs>
    <Paragraph>
      <TextRuns>
        <TextRun>
          <Value>Group</Value>
          <Style>
            <FontWeight>Bold</FontWeight>
          </Style>
        </TextRun>
        <TextRun>
          <Value>?</Value>
          <Style>
            <FontFamily>Wingdings</FontFamily>
          </Style>
        </TextRun>
      </TextRuns>
    </Paragraph>
    <Paragraph>
      <TextRuns>
        <TextRun>
          <Value>?</Value>
          <Style>
            <FontFamily>Wingdings</FontFamily>
          </Style>
        </TextRun>
        <TextRun>
          <Value>Period</Value>
          <Style>
            <FontWeight>Bold</FontWeight>
          </Style>
        </TextRun>
      </TextRuns>
    </Paragraph>
  </Paragraphs>
  <Style>
    <PaddingTop>2pt</PaddingTop>
    <PaddingBottom>2pt</PaddingBottom>
    <PaddingLeft>2pt</PaddingLeft>
    <PaddingRight>2pt</PaddingRight>
  </Style>
</Textbox>
Conclusion
I
showed how a report as complex as periodic table with hyperlinks and graphical
images can be dynamically generated for the Report Viewer control.
Reference
Below
is the link of the latest version of the RDL spec that is used in Visual Studio
2013:
http://download.microsoft.com/download/B/E/1/BE1AABB3-6ED8-4C3C-AF91-448AB733B1AF/Report%20Definition.xps
History
12/29/2013:
Initial post
He started his career as a PDP-11 assembly language programmer in downtown Tokyo, learning what "patience" in real life means by punching a 110 baud ASR-33 Teletype frantically. He used to be able to put in the absolute loader sequence through the switch panel without consulting the DEC programming card.
Since then, his computer language experiences include 8051 assembly, FOCAL, BASIC, FORTRAN-IV, Turbo/MS C, VB. VB.NET, and C#.
Now, he lives with his wife, two grown-up kids (get out of my place!), and two cats in Westerville, Ohio.


 General
  News
News  Suggestion
  Question
  Bug
Bug  Answer
  Joke
Joke  Praise
  Rant
Rant  Admin
Admin 


 Any leads?