Introduction
This article explains debugging Memory Leaks in an easy and simpler way for Windows Applications. The scope of this article is limited to user-mode debugging. This article covers debugging technique using CRT APIs.
Note:This is series of articles divided into 5 parts
Part 1: Windows Debugging Techniques - Debugging Application Crash (Windbg)
Part 2: Windows Debugging Techniques - Debugging Application Crash (DebugDiag, AppVerifier)
Part 3: Windows Debugging Techniques - Debugging Application Crash (Self Dump Generation)
Part 4: Windows Debugging Techniques - Debugging Memory Leaks (Perfmon)
Part 5: Windows Debugging Techniques - Debugging Memory Leaks (CRT APIs)
Background
As observed in Part 4, it can be difficult to trace the issue with just the help of perfmon tool. It would be so easy if someone could actually point where the precise location of the leak is and we all we have to do is fix it. There are CRT APIs available which does this for us and makes life easier.
Definition
We all know when we allocate memory dynamically using new/malloc/calloc/realloc it actually goes to the heap memory.
Debugging Memory Leak issues means debugging the heap memory and checking to see if there is a problem there. CRT Debug Heap provides this arrangement by providing a set of APIs which allocate more memory than actually requested to track the memory details
and dump the same on application exit.
So if we allocate 10 bytes in release mode using malloc, then only 10 bytes will get allocated. But once we enable debugging using CRT APIs close to 46 bytes will get allocated. This extra 36 bytes are there for tracing the memory leaks.
Apart from this, instead of malloc, debug version i.e "_malloc_dbg" will be called.
For more information on this please refer to: http://msdn.microsoft.com/en-us/library/974tc9t1.aspx
Debugging Techniques
Let's go Step-by-Step in using the CRT APIs
Step 1: Add the Includes for CRT Debug API
Add the below code as part of the application after all other includes are completed.
#define _CRTDBG_MAP_ALLOC
#include <stdlib.h>
#include <crtdbg.h>
Macro _CRTDBG_MAP_ALLOC informs the compiler to map the heap functions to their debug version i.e. malloc should get mapped to _malloc_dbg
Step 2: Map new operator to its debug version
By default, new does not get mapped to its debug version, we need to forcefully do it. To do this add the below code to the application. By default, malloc/calloc/realloc gets mapped to their debug version. New needs to be done explicitly.
This step can be avoided if you do not have the usage of the new operator in your code.
#ifdef _DEBUG
#ifndef DBG_NEW
#define DBG_NEW new ( _NORMAL_BLOCK , __FILE__ , __LINE__ )
#define new DBG_NEW
#endif
#endif
Step 3: Set the Debug Flag and Set the report mode
Debug flags needs to be set, which defines what we want to debug. Report Mode needs to be set to define if the output needs to be redirected to the debug window like DebugView or needs to be sent to a file.
_CrtSetDbgFlag ( _CRTDBG_ALLOC_MEM_DF | _CRTDBG_LEAK_CHECK_DF );
_CrtSetReportMode(_CRT_WARN, _CRTDBG_MODE_DEBUG);
Let's understand the above code.
_CRTDBG_ALLOC_MEM_DF turns on debug allocations
_CRTDBG_LEAK_CHECK_DF will cause memory leak checking to be performed on application exit.
_CRTDBG_MODE_DEBUG will cause the output to be redirected to a debug window like DebugView or Output Window in Visual Studio.
There are a lot more options available for debugging. Please refer to: http://msdn.microsoft.com/en-us/library/974tc9t1.aspx
After the above steps the code mentioned in part 4 would become like this.
#include <iostream>
#include <Windows.h>
#include <tchar.h>
#include <string>
#define _CRTDBG_MAP_ALLOC
#include <stdlib.h>
#include <crtdbg.h>

#ifdef _DEBUG
#ifndef DBG_NEW
#define DBG_NEW new ( _NORMAL_BLOCK , __FILE__ , __LINE__ )
#define new DBG_NEW
#endif
#endif  // _DEBUG

using namespace std;

bool GetComputerName(wstring& wstrCompName);
bool fileread(const wstring& filepath);
bool GetUserName(wstring& wstrUserName);

int main()
{
	_CrtSetDbgFlag ( _CRTDBG_ALLOC_MEM_DF | _CRTDBG_LEAK_CHECK_DF );
	_CrtSetReportMode(_CRT_WARN, _CRTDBG_MODE_DEBUG);

	int nChoice = 0;
	wstring wstrCompName;
	wstring wstrUserName;
	char ccontinue = '\0';

	do
	{
		wcout<<L"Enter your choice"<<endl;
		wcout<<L"1.Read Computer name"<<endl;
		wcout<<L"2.Read User Name"<<endl;
		cin>>nChoice;

		switch(nChoice)
		{
		case 1:
			GetComputerName(wstrCompName);
			wcout<<L"Computer name read is"<<wstrCompName.c_str()<<endl;
			break;
		case 2:
			GetUserName(wstrUserName);
			wcout<<L"user name read is"<<wstrUserName.c_str()<<endl;
			break;
		default:
			wcout<<L"Invalid option";
		}
		wcout<<"Do you want to continue Y or N";
		cin>>ccontinue;
	}while(ccontinue == 'y' || ccontinue == 'Y');
	return 0;
}

bool GetComputerName(wstring& wstrCompName)
{
	wchar_t* pwszCompName = NULL;
	DWORD dwSize = 0;
	bool bRet = false;

	if (!GetComputerNameEx(ComputerNameDnsHostname, pwszCompName, &dwSize))
	{
		if(GetLastError() != ERROR_MORE_DATA)
		{
			wcout<<L"GetComputerNameEx Failed with Error Code"<<GetLastError();
			return false;
		}
		pwszCompName = new wchar_t[dwSize + 1];
		if(pwszCompName == NULL)
		{
			wcout<<L"unable to allocate memory"<<endl;
			return false;
		}
		memset(pwszCompName, L'\0', dwSize + 1);
		if (!GetComputerNameEx(ComputerNameDnsHostname, pwszCompName, &dwSize))
		{
			wcout<<L"GetComputerNameEx Failed with Error Code"<<GetLastError();
			return false;
		}
	}
	char* test = new char[1024*1024];
	wstrCompName.assign(pwszCompName);
	return true;
}


bool GetUserName(wstring& wstrUserName)
{
	wchar_t* pwszUserName = NULL;
	DWORD dwSize = 0;

	if(!GetUserName(pwszUserName, &dwSize))
	{
		if(GetLastError() != ERROR_INSUFFICIENT_BUFFER)
		{
			wcout<<"GetUserName returned with Error"<<GetLastError();
			return false;
		}
		pwszUserName = new wchar_t[dwSize + 1]();
		if(pwszUserName == NULL)
		{
			return false;
		}
		if(!GetUserName(pwszUserName, &dwSize))
		{
			if(pwszUserName)
			{
				delete [] pwszUserName;
				pwszUserName = NULL;
			}
			wcout<<"GetUserName returned with Error"<<GetLastError();
			return false;
		}
	}
	wstrUserName.assign(pwszUserName);
	if(pwszUserName)
	{
		delete [] pwszUserName;
		pwszUserName = NULL;
	}
	return true;
}
Step 4: Rebuild the Project in the Debug Mode
One drawback of this approach is it requires code to be rebuilt in debug mode without which it cannot report memory leaks. So rebuild the source in the Debug Mode.
Step 5: Launch the DebugView, Run the use case and see the output
Launch the DebugView. If not available, download it from: http://technet.microsoft.com/en-in/sysinternals/bb896647.aspx
In the current case, build the above mentioned code in Debug Mode, Run the Application, select option 1, and then select y. Repeat this three to four times, and press n and exit the application. Observe the debugView output. It will look something like this:
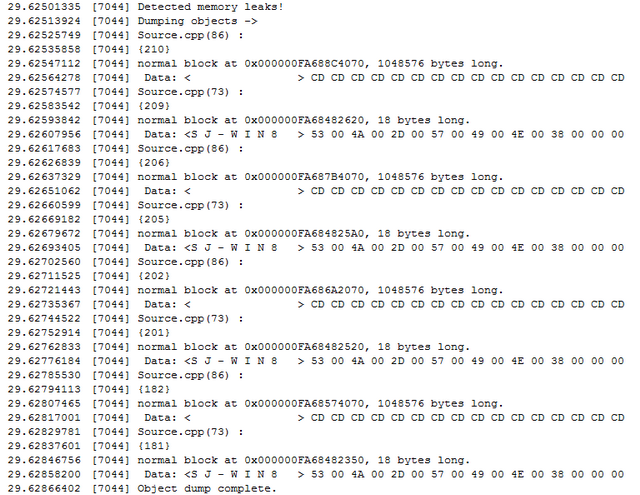
With this now we get exactly which file and which line of code is causing the memory and how much leak. When it says source.cpp line no 73, it is actually pwszCompName = new wchar_t[dwSize + 1];. Similarly, line no 86 points to char* test = new char[1024*1024];. Now it is very clear where the problem is and we can fix the issue easily.
Summary
The above mentioned technique is one of the easiest and most effective ways to debug the memory leak. There are lot more different options in CRT Debug APIs, which should be used to understand other ways to debug. This approach is limited to heap memory leaks. This does not cover handle leaks or growth in the number of threads. For this we still have to rely on perfmon and trace the code based on use case and fix them.
References
History
- 2014-02-10: Article upload
A Technology Enthusiast since 14 Years, have been contributing in varied Domains. Interested in developing technology which goes more meaning to Human Life, Nature and the entire ecosystem.
#Developer, #Architect, #Enthusiast, #Contributor #Mentor
To all Developers out there, You touch a Billion Lives a Billion Times
Before you code Think Twice !!!


