This blog was original posted on the Keyhole Software blog on 3/3/2014.
Overview
This is the third part in my series on Advanced Debugging Techniques in JavaScript. Part 1 introduced Validate Your Assumptions, Binary Search, and the debugger statement. Part 2 covered Bottom-Up debugging, Top-Down debugging, and Break on DOM changes.
This blog goes into more of the Chrome-specific debugging techniques that I use on a regular basis. The last part of the series will be focused on how teams that use Agile can help their developers and QAs debug JavaScript effectively.
Conditional Breakpoints
Up to this point, I’ve covered setting a static breakpoint using the debugger statement. This works well in cases where the programmer has the ability to directly update the code they’re testing. If they need to do debugging on a third-party library, then a browser breakpoint is required.
Third party libraries are heavy on code reuse. The programmer doing the debugging may put a breakpoint in a hot segment of code. If the breakpoint gets hit over and over again, the false-positives can overwhelm the true positives. Conditional breakpoints can help alleviate this.
Let’s say I have a controller that looks like the following:
this.application.on('SOME_EVENT', this.onSomeEvent, this);
This expects that some other piece of code will do:
this.application.fireEvent('SOME_EVENT');
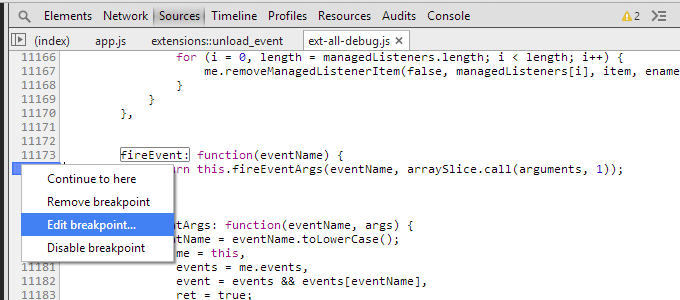
If I never see my callback getting hit, I could put a breakpoint on the fireEvent method. This is not the best solution as it can be a method called by many other pieces of code.
First, right clicking on the line number, then selecting Edit breakpoint:
When the expression returns true, it will evaluate as a normal breakpoint. If it returns false, it will skip it:

One technique I use is to log data to the console so I can see how my expression was evaluated. In the case above, I’m just logging which event was seen. There are other times where my conditional breakpoint is in a loop, and my expression needs to return true at a specific index. If I output the index and some data on my bug, I can see which index the loop was at when the bug occurred.
Another technique I use are global flags. I’ve had situations where I want the expression to return true the second time but not the first. If I add on a && to my expression, I can achieve it by checking the flag:
When eventName is SOME_EVENT, I then check if my global flag has been set. If it has, then I know I’m on the second time, and need to evaluate to true. If it hasn’t, then I need to set it and ignore this call. That is why I append a && flag to the assignment. JavaScript evaluates (window.ZG = true) as true. If I didn’t append false, then I would get a breakpoint on the first time.
The same principles can be applied to conditional breakpoints on code the developer has the ability to modify. Global flags need to be easily recognizable as temporary variables. Most developers use their initials to make it stand out, which is why I chose ZG for mine. Depending on the situation, they can be integers as well.
Event Listener Breakpoints (Chrome)
In bottom-up debugging, there are some situations where placing a debugger is difficult. The code could be owned by a third-party, or it may not be obvious where to place the debugger. Most of the situations like this revolve around some sort of user input. All JavaScript libraries have their own way of handling user input, so there is little insight that can be gained by reading the code to figure out where to put it.
Chrome’s developer tools do offer some help when it comes to user interaction. The Event Listener Breakpoints panel allows a developer to see what code responds to different browser events.
To see the panel, open Dev Tools, go to Source, then expand Event Listener Breakpoints on the right side:
If the programmer sees a bug happening when the user clicks, they can expand the Mouse section, and listen for mouseup and click. Most JavaScript frameworks listen for one of these events and fire a callback when triggered. If the bug happens after pressing a key, keyup is the most common event to listen for.
There are some situations where using these breakpoints is very difficult. If a breakpoint is set on mousedown and the framework expects mousedown then mouseup within a certain timeframe, then the effort to observe the bug has made it not appear. Conditional breakpoints can help by allowing the developer to toggle these events to make sure the bug is still reproducible.
Observing Changes (Chrome)
Member variables and methods in JavaScript are by nature public. JavaScript doesn’t have a notion of protected or private variables or methods. This can result in some bugs that are hard to track down because getters and setters may have not been used. This usually manifests itself when one class accidentally updates a private member variable of another without going through the setter.
To observe when a property of an object changes, a getter and setter can be explicitly defined for the object:
constructor: function () {
     this.myObject = {
          someInt: 1
     };
     var someInt = this.myObject.someInt;
     this.myObject.__defineSetter__('someInt',
     function (sI) { debugger; someInt = si; return someInt; });
     this.myObject.__defineGetter__('someInt', function () { return someInt; });
}
When this.myObject.someInt is changed, the debugger statement can show in the call stack which class is updating the value. This is a quick way to isolate offending classes that ignore private/protected documentation.
If the offending class sets this.myObject to a new object, the setter will not be called. In that case, a getter/setter can be set on this to observe changes in the myObject key.
Another “gotcha” comes in situations where the setter can’t be directly observed. If the property that needs to be observed comes from a class that is extended by a large number of classes, there can be too many false-positives to yield any results. There is no concrete way around this situation. If the value that causes the bug is a property of an object (e.g. google.maps.SomeValue), then a getter/setter can be placed on the object with a debugger statement in the getter.
The post Advanced Debugging Techniques in JavaScript – Part 3 appeared first on Zach Gardner's Blog.
This member has not yet provided a Biography. Assume it's interesting and varied, and probably something to do with programming.


