Introduction
User experience (UX) is a game-changer for products today. While other features are important in the functionality of a device, none can overcome a perceived or actual lack of response and ease of use through touch. Since Windows 8 was introduced, touch gestures have become a primary way of interacting with Windows-based Ultrabook™ devices, tablets, and phones. The usefulness of these systems is based partly on how touch improves the user experience (UX), and by extension, how the quality of the UX is impacted by the speed and responsiveness of the touch interface.
Touch response time is the latency from when users begin to move their fingers to perform touch gestures to the point at which the application provides a visual update that they expect from their performed gestures. Touch response is measured in very small time samples (100-500 ms range). It is important to identify and optimize poor performing touch response areas to achieve the best UX.
Touch enabling for Windows applications is a whole new ballgame—from measurement to analysis and optimization. An assumption that is not always true is that if an application is always updating a scene, it will quickly respond to the user’s touch gesture. This paper discusses ways to measure touch response, analysis methods for touch optimization on Intel® Architecture (IA), and the combination of tools needed to understand issues related to touch response.
In addition to touch response time, computer resource utilization and battery life are very important factors impacting the UX. This paper describes two applications that demonstrate problems such as poor or no touch response times and high energy consumption, both of which are critical to app performance and UX. We then discuss how to optimize these applications to resolve these problems.
Why is Implementing a Good Touch UX Important?
Ultrabook devices and tablets are seeing growing adoption by the market, and touch is one of the essential pillars of delivering a good user experience (UX). Touch-capable devices are everywhere, from phones, tablets, Ultrabooks to All-In-Ones (AIOs), which are desktop PCs with the tower integrated into the back of the display. Gartner, an IT research company, expects that by 2015 more than 50% of the PCs purchased for users under age 15 will have touch screens [1].
With Windows 8, Microsoft established the Windows Store, which acts as a central touch-driven hub for developers to publish their applications and for consumers to purchase them. If an application has noticeable delay to the user’s touch gesture, the application may be rated poorly, which will, no doubt, affect its sales.
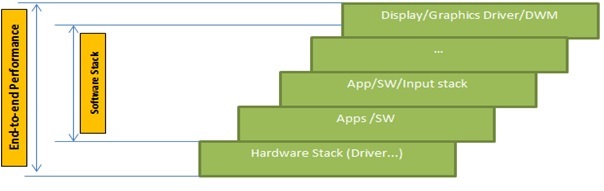
Figure 1. Role of Software in Touch Stack
Figure 1 shows the critical role software and drivers have in touch responsiveness where 3 out of the 5 layers belong to the software stack (making up ~60%). Poor touch responsiveness is usually an issue in the software stack.
Touch Handling
Windows desktop applications have three ways to support touch input and gestures. To fully understand the usage of these touch APIs, please read "About Messages and Message Queues" [7]. The WM_GESTURE and WM_TOUCH messages are both backward compatible with Windows 7, whereas the WM_POINTER messages are not. Each message has advantages and disadvantages. WM_POINTER is the simplest to implement but provides the least amount of control. WM_TOUCH requires the most amount of code but allows for very fine-tuned control, and WM_GESTURE is in the middle. Many approaches can be used for supporting touch in Windows Store apps, from the GestureRecognizer class that handles touch inputs and manipulations to using the DirectManipulation APIs that were introduced in Windows 8.1.
The Energy Savings Bonus from Optimizing Touch
Energy is another important pillar in delivering a great user experience. The usability of an application is affected by the energy it consumes and how it impacts battery life. If the application rapidly drains energy, users will be reluctant to run the application. High energy consumption usually results from heavy usage of the system’s resources, i.e., the CPU, GPU, and even storage devices performing unnecessary work. The case studies below demonstrate these issues and highlight a secondary effect often seen when optimizing touch handling capabilities where the application’s energy consumption is reduced. This secondary effect of reduced energy consumption is what we refer to as the “energy savings bonus.”
Windows Tools for Touch Analysis
Many tools can be used to help you optimize your Windows touch-based applications. Understanding the use of each tool for measurement and analysis is essential to pinpointing touch-related issues. Below are brief tool descriptions, their intended uses, and relevance to particular aspects of touch analysis.
- Measurement Tools
- Measuring response time using a high resolution camera
- Record a video of touch interactions and manually step through it frame by frame to obtain response times.
- Windows PerfMon
- Pre-packaged with Windows to look at CPU and other system stats.
- This tool collects at a one second granularity and provides an overview of the system’s behavior when the app is running.
- Intel® Power Gadget
- Gathers power/energy metrics such as package (CPU and GPU) power consumption.
- Windows Performance Recorder (WPR)
- Packaged with Windows 8/8.1 ADK.
- WPR has a user interface (WPRUI) that allows traces to be performed that collect specific system metrics like CPU utilization, virtual memory commits, power consumption, etc.
- FRAPS
- Reports an application’s rendering rate (FPS) and only works on desktop applications.
- Although the web site says it only supports up to Windows 7, you can use this on Windows 8/8.1 desktop applications.
- Analysis Tools
- Windows Performance Analyzer (WPA)
- Packaged with Windows 8/8.1 ADK.
- WPA is used to load the .etl file generated by WPR so that in-depth analysis can be performed.
- Intel® VTune™ Amplifier XE 2013
- Allows developers to understand which functions/modules are most time consuming.
- Provides detailed view of thread scheduling.
- Intel® Performance Bottleneck Analyzer (PBA)
- Provides advanced analysis capabilities for responsiveness optimizations.
- GPUView
- Packaged with Windows 8/8.1 ADK and provides an in-depth look at what is occurring between the CPU context queue and the GPU hardware queue. Use the WPRUI trace option “GPU activity” when collecting this information.
- Intel® Graphics Performance Analyzer (Intel® GPA)
- Provides information about graphics activity on the system including frame rate.
- Questions to ask when using these tools
- Does Intel Power Gadget report a package (CPU and GPU) power consumption that is much larger than the baseline?
- Does the Windows Performance Analyzer show high CPU usage?
- Does the scene have any visual updates?
- If there are spikes in CPU usage, what is occurring on screen? Maybe an animation that occurs every three seconds causes the CPU usage to increase every three seconds.
- Does GPUView show that the CPU/GPU queue is backed up?
- What does Intel Performance Bottleneck Analyzer show in the timeline view?
- Filter on the module consuming the most CPU time and see what module/thread activity is occurring.
- Does the application change the system’s timer tick resolution from 15.6 ms (Windows default) down to a smaller value?
- If the application is changing the system’s timer tick resolution to a smaller value, i.e., 1 ms, the application will perform Update and Draw calls too frequently, which can back up the CPU context queue and/or GPU queue.
Now let’s look at how these tools were used to optimize two applications and answer some of the questions above.
Case Studies
For these particular case studies, the high resolution camera method was used to obtain an average response time of ~200 ms. In these contexts, not only did the applications have slow touch response, but often the applications failed to respond to a touch gesture entirely.
A Casual Multi-User Multi-Touch Game Application with Poor Touch Response
1. Problem Statement
This Windows desktop application had latency delays around ~170 ms. But even worse, the application often failed to provide a response at all (no visual update for gesture). Since this was a sports game, these touch response issues would often cause unfair scoring to occur.
2. Using the Tools to Identify Issues
The first tool we used was Windows Perfmon since it collects data that provides an overview of what is occurring on the system while the application is running. Looking at the application’s resource utilization when no touch gestures are performed provides an idea of what will cause most of the bottleneck when a touch does occur. We could see here if certain resources like the CPU usage, context switch rate, interrupt rate, etc. were already maxed out (100% utilization) or above threshold values obtained based on analysis from previous workloads.

Figure 2. Application Idle, CPU Usage at 100%
Figure 2 shows a single CPU core (processor 0) is utilized 100% of the time, which means this single-core application was CPU-bound when updating a visually unchanging scene.
The next tool, Intel Power Gadget, was used to get an idea of the impact caused by the application using a single CPU core 100% of the time. We ran the command prompt as admin, navigated to the installation directory, and entered:
PowerLog3.0.exe –duration <duration to run for in seconds> –file <log_file.csv>
After running the command, we typed the name of the log_file.csv and pressed Enter. Figure 3 shows the package (CPU and GPU) power consumption of the system while the application was running and not handling touch interactions. The x-axis is the sampling rate at which the energy MSRs were read, and the y-axis is the processor power in watts [3].
Figure 3. Application Idle Package (CPU and GPU) Power Consumption in Watts
The same behavior occurred when touch gestures were performed, as indicated in CPU usage charts, even when power remained almost the same with and without touch interactions. This clearly indicates that something was consuming all the resources, making it difficult for touch to respond. The system’s power consumption when the application was not running was ~2.5 W, which meant the application caused a 9 W increase in power. What was causing this 9 W CPU and GPU power consumption increase?
Next, Intel GPA was used where a rendering rate of ~350 frames per second (FPS) was reported while the application was not handling touch gestures and ~210 FPS when touch gestures were performed. Although it is constantly debated, a common consensus is the human eye cannot usually distinguish the difference between one app rendering at 60 FPS and one rendering at 120 FPS. This meant that users would see the same visual updates on screen at 210 FPS as if the application were rendering at 60 FPS.
Next, GPUView was used and showed this high rendering rate caused the GPU queue to be full as the application was trying to submit the job to GPU pipeline as soon as possible. Figure 4 shows rows of packets with double hash marks, which indicates a present packet ready to be displayed to the screen. This activity was occurring while the application was displaying a screen with no visual updates.
Figure 4. Screen Shots of Backed-up GPU/CPU queues from GPUView tool
What was causing the CPU usage to be 100% and the CPU/GPU queues to be backed up?
WPRUI was used next, and the only trace option selected was CPU usage to reduce overhead caused by the tool. When collecting on idle scenarios, take into consideration the amount of overhead caused by the tool itself. At this point, we knew the application was making the CPU/GPU queues back up, so what was being called before the graphics module? By inspecting the application’s call stack to the graphics module, we found some clues as to what was being called that accounted for this needless work.
Figure 5. Application’s Hot-Call Stack
Inspecting the call stack shown in Figure 5 showed a Game::Tick method called shortly before a D3D9 Present call was made, which eventually lead to the graphics module igdumd32.dll. This Game::Tick method unintentionally was setting the system’s timer tick resolution to 1 ms, down from 15.6 ms (Windows default). See Figure 6.
Figure 6. The Game Tick Method Changing the System Timer Resolution
So every 1 ms, the application would perform Update and Draw calls since that is when Game::Tick was called. Calling these methods every millisecond also meant the CPU wakes up often, not going into deeper sleep states (C-states), and the GPU is busy more than necessary.
3. End Result
APIs are available to ensure that an application does not change the system’s timer tick resolution and that the application is synchronized to the Vsync. After using these types of APIs, the CPU was no longer spending 100% of execution time on Update and Draw calls.
Figure 7. Optimized Application CPU Usage
Since the CPU was no longer executing needless Update calculations and Draw calls every millisecond, the CPU context queue and GPU queue were no longer backed up. The screen shot in Figure 8 shows work submitted at 60 FPS since the refresh rate of the display was 60 Hz.
Figure 8. Optimized Application CPU and GPU Queue Activity
The application’s rendering rate was now capped at 60 FPS since a present packet is submitted at every Vsync on a monitor with a 60 Hz refresh rate. By optimizing the application’s resource consumption in an idle scenario (no visual changes to the screen and no touch gestures handled), touch responses were faster and smoother. The average touch response time of the optimized application was around 110 ms, where before it averaged around 170 ms, and touches were no longer lost (no response from application).
As an added bonus (the energy savings bonus), the package power consumption of the system was reduced by ~8.5 W. Now users could play the application on their favorite Windows mobile device for a longer period of time before having to recharge the battery.
In summary, idle application behavior can cause the application to flood the touch handling pipeline. With the optimized version, the application had more head room to handle additional touch gestures, giving it the benefit of decreased touch latency.
A 3D Casual Game Application with Lost Touch Response
1. Problem Statement
This case study is a 3D free-running game on Windows 8 Desktop that uses WM_TOUCH messages to handle touch inputs. To play the game, the user flicks the screen at different orientations to make an avatar perform different actions (such as jump, slide, squat, etc.). If no touch gestures are performed, the avatar keeps running forward on a fixed path.
In the original version of the game, when two types of touch interactions were performed, the avatar would not perform the expected action and simply continue to run forward.
- When two flicks were performed successively, if the time interval between them was too small, the second flick usually had no response.
- When the distance of a flick moving on the touch screen was too short, the flick usually had no response.
2. Using the Tools to Identify Issues
- Isolate the Issue. Determine if the touch response issues are due to the application or the platform (hardware/driver/OS). The method recommended here is to run WPR, switch to the application, and perform a single touch gesture at specific times during the data collection to visually show the touch events and their durations during analysis.
Figure 9. Marking Touches with Response and Touches with No Response
Manually record the touch events with and without response. By having a process that tracks touch registration, we were able to mark when the OS had registered the touch by inspecting the call stack for message processing functions as shown in Figure 9 (purple spikes).
- Compare Good UX vs. Bad UX Call Stacks. Comparing various aspects of a touch that has a response (Good UX) to a touch that has no response (Bad UX) will often show a difference in which functions are called by the application.
The call stacks containing FrameMove() were investigated since that function, as the name implies, provides a visual update. In the call stack of "Good UX" a function AvatarMovesToTheLeft::FrameMove is called, while in the "Bad UX," it is not called (see Figure 10).
Figure 10. Touch with Response vs. Touch without Response Call Stacks
- Trace the Call Stacks. By tracing the “Bad UX” call stack, we discovered where the call chain broke. Windows message processing functions were called, including
PeekMessage, DispatchMessage, and even the game’s WndProc function. This confirmed that all touch inputs were received by the application’s message processing function, but the xxxSlideLeftState or xxxSlideRightState functions that set the avatar’s run mode for the expected animation were not called (see Figure 11).
Figure 11. Bad UX Message Processing Call Stack
3. End Result
- The cause of the quick successive flick loss is that the flick gesture acts on the game only if the avatar’s run mode is in the state of "Run forward." If it is in a different state, the touch input will be abandoned. For example, after the first flick gesture, the state of the run mode changes from "Run forward" to "Slide to Right." If the second flick comes quickly before the state returns to "Run forward," it will be discarded. The issue was fixed by caching the touch messages for the appropriate run mode.
- The cause of the short flick loss was related to the game’s
WndProc function. The game recognized the flick gesture only if its length was more than 60 logical pixels, which is why some short flicks were lost. Given the same resolution, 60 logical pixels cover a longer physical distance on an Ultrabook screen than on an iPhone* screen. This makes short flicks on a game ported from the iPhone platform to Ultrabook more prone to be lost on the Ultrabook screen. The solution was to set the threshold of the flick length based on the physical distance on screen using dots per inch (DPI) instead of logical pixels.
In summary, we isolated the issues as either app- or platform-related by comparing Windows messaging API calls to determine if and where the OS had registered the touch. Then the call stacks belonging to touch gestures that had an expected response (Good UX) and gestures with no response (Bad UX) were compared to find differences in functions that were called. Finally, the game’s message processing call stack for a touch that was lost was traced upstream to find where the break in the call chain occurred. The start of the call stack trace was from the functions that were called in the Good UX call stack but not in the Bad UX call stack.
Conclusion
Optimizing touch is essential, and many tools are available for measurement and analysis. Remember to have a reference point (baseline) to which you can compare the data you have collected while your application is running. Look at the differences in data obtained while the application is simply running with data obtained performing touch gestures. Compare the application’s behavior when it responds to a touch and when it does not.
The assumption—if an application is always updating a scene, it will quickly respond to the user’s touch gesture—is not always true. A scene should only update when it is necessary in order to conserve system resources that can be used to quickly respond to a touch gesture when one occurs. Often, needlessly updating a scene for unimportant animations will cause the Windows message, CPU, or GPU queues to back up, which can subsequently cause delays in providing a visual response to the user’s touch.
References
[1] Fiering, Leslie. Gartner Says More Than 50 Percent of PCs Purchased for Users Under the Age of 15 Will Have Touchscreens by 2015. Gartner, 7 Apr. 2010. Web. 03 Mar. 2014.
[2] Chabukswar, Rajshree, Mike Chynoweth, and Erik Niemeyer. Intel® Performance Bottleneck Analyzer. Intel Corporation, 4 Aug. 2011. Web. 12 Feb. 2014.
[3] Seung-Woo Kim, Joseph Jin-Sung Lee, Vardhan Dugar, Jun De Vega. Intel® Power Gadget. Intel Corporation, 7 Jan. 2014. Web. 25 March 2014.
[4] Freeman, Jeffrey M. "Intel® Graphics Performance Analyzers (Intel® GPA) FAQ." Intel Corporation, 17 Dec. 2013. Web. 25 Mar. 2014.
[5] H, Victor. "iPhones Score Highest Touch Responsiveness, More than Twice as Responsive as Android and Windows Phone Devices." Phone Arena. Phonearena, 01 Oct. 2013. Web. 26 Mar. 2014.
[6] "Windows Assessment and Deployment Kit (Windows ADK)." Microsoft Corporation, 2 April. 2014. Web. 3 April. 2014.
[7] "About Messages and Message Queues." Microsoft Corporation, 24 Jan. 2012. Web. 26 Mar. 2014.
[8] Intel® VTune Amplifier XE 2014. Intel Corporation, 6 Mar. 2014. Web. 3 April 2014.
[9] Fraps 3.5.99. Fraps, 26 Feb. 2013. Web. 3 April. 2014.p>
Related Content
How to Create a Usable Touch UI
How to Adjust Controls for Touch
This member has not yet provided a Biography. Assume it's interesting and varied, and probably something to do with programming.


 General
  News
News  Suggestion
  Question
  Bug
Bug  Answer
  Joke
Joke  Praise
  Rant
Rant  Admin
Admin 


