md5sum: 3c70aab5248e9beddf2142a4b366fb2f
Introduction
This circuit/application targets a set of integer values between 0 and n where:
- n is [(an even power of 2) -1], e.g. 255, 511, 1023, …
- The sequence (probably) can only be communicated by enumerating the values individually (maximum algorithmic entropy). There is no pattern, shorthand expression, or effective compression method.
- Each value has an equal likelihood of occurring but they do not (necessarily) occur equally often.
- The process creating the set is substantially unlikely to repeat itself and no matching initial condition will result in a repeating sequence (not determinative).
- The values are not correlated with previous values.
Some of these requirements will fail as the sequence length approaches infinity. Some of them are impossible to absolutely measure (and, in a random sequence, they should be if there is to be no pattern). We would also like to be able to scale the values in a set without introducing a conflict with our requirements.
The application will run on Linux or Windows. It has not been tested on other platforms.
Prerequisites
- Follow the instructions for Arduino setup on your platform (http://arduino.cc/en/Guide/HomePage).
- Be certain that you understand the analog read procedure. The best way is to implement the project at http://arduino.cc/en/Tutorial/AnalogReadSerial.
- The circuit requires components that are not included in the starter kit. You should have a collection of components including the ones shown in the schematics in this article.
- You will need test equipment including, at minimum, a multi-meter.
- You will need a ripple free power supply that provides +/- 12 VDC
- You should be familiar with basic electronics and electronics safety.
Circuit details
The Arduino starter kit includes several BC547 transistors. The BC547 has an emitter-base breakdown voltage of ~ 6V and can be used as a Zener diode when reverse biased. The schematic below, where the upper BC546 is configured as a reverse-biased Zener diode, generates a white noise signal.
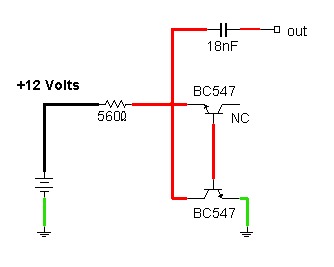
The noise is a combination of avalanche noise, shot noise, and thermal noise, but avalanche noise probably predominates. The following trace shows the signal, where the major time division is 2 µs.

The signal must be conditioned before we can acquire it effectively with the Arduino serial input. Below is a circuit that does this. First, the signal from the noise source is amplified in two stages using OP77 op amps to better utilize the Arduino’s ADC input range. Next, it is centered at 2.50 VDC by summing the amplifier output with a trimmable -2.5 VDC signal from a voltage divider (labeled offset) then fed to an inverting LM741 op amp with a gain that can be trimmed (labeled gain). Finally, the signal is connected to a 5V Zener voltage limiter to provide added protection to the Arduino analog-in pin.
The following trace shows the conditioned signal, again with a time axis of 2 µs/division. Note that it has lost some of its high frequency component, a consequence of amplification using the simple, low cost circuit design. For this application, the loss is not important.
Before connecting to the Arduino, verify that the conditioned signal ranges between 0 and 5 volts. The crest factor of the signal is high and typical multi-meters are not a reliable for measuring the signal strength. The DC output of the LM741 op amp should be +2.5 VDC. The Zener voltage limiter will limit positive signal fluctuations but negative excursions may exceed the Arduino analog input specifications. An oscilloscope is the best way to verify voltage compliance. After being convinced that the conditioned signal varies between 0 V and 5 V, the circuit and the Arduino are connected to a common ground and the conditioned signal source is connected to the A0 Arduino analog input.
The Arduino sketch
The A0 serial-in pin connects to an analog-to-digital converter that will convert a 0-5 V analog input to a 10-bit digital value (0 to 1023). The value is communicated via the USB port as a string. The baud rate is 115200. The loop reads the value and prints it to the usb port followed by a line ending.
/*Analog Pin writer for transistor noise experiment */
void setup()
{
  Serial.begin(115200);
}
void loop()  {
  int v = analogRead(0);
  Serial.print(v);
  Serial.print("\n");
}
To test, you can use the Arduino Serial Monitor to collect data. Be sure to set the port and the baud rate correctly.
Using Linux, before you read the digitized signal from the USB port you must configure your OS to read the input at the desired baud rate. The following command does this:
Linux, current boot only
stty -F /dev/ttyACM0 115200
Again with Linux, you can bypass the Serial Monitor entirely with:
cat /dev/ttyACM0
You can read the port for 30 seconds and save the output to a file named test with:
timeout 30s cat /dev/ttyACM0 > test
If you enter the data into a spreadsheet you may see a few corrupted values or values above 1023 early in the sequence that you should delete. If you graph the data, you should see something like the image below.
Signal Characteristics
The raw signal is Gaussian noise and not a random sequence. If you tabulate the number of occurrences for each value from 0 to 1023 and plot the frequency of occurrence vs. the value, you will see the signal’s probability density function (PDF). In the example below the magenta line represents a scaled, ideal Gaussian distribution synthesized using the sample’s mean and standard deviation.
The values at the tail ends of the distribution should be zero and the peak should be at ~512. If they are not, then adjust the gain and the offset.
Creating a random sequence
If the raw signal’s probability density function nearly approximates a Gaussian distribution, then the signal can be used to generate a uniform distribution by creating a new signal from the original such that: the new value at a given index is 1 when the corresponding raw value is above the mean, zero when it is below the mean, and not used if it is at the mean. This produces a uniform distribution that may be used to assemble random numbers.
Note that this signal is shorter than the raw signal because values at the mean have been discarded. It also may not be very useful because it only has one bit of entropy, but we can combine adjacent values block-wise to compute a uniformly distributed signal with higher entropy. For example, say we have the following binary sequence: {0,0,0,0,1,1,1,1,1,0,0,1}. We can create a sequence with 4 bit of entropy from it: {0, 15, 9}. Using this strategy to process the uniform single bit distribution to a uniform 8 bit distribution we obtain:
Note that it is not a uniform blur (a good sign). Below is the probability density function, which appears uniform, as indicated by the red horizontal fit line. Also notice that we reduced the signal’s length by a factor of 8 when we combined adjacent bits. Your fit line will not always have a zero slope but it should fluctuate from positive to negative in repeated runs.
In the circuit, we conditioned a white noise signal to make it compatible with the Arduino. The Arduino converted the conditioned signal from the circuit to a digital signal. We inspected the digital signal to confirm that it is Gaussian noise. Being satisfied, we used it to create a uniform bit sequence and, finally, a uniform 8 bit sequence. We inspected the 8 bit sequence and its probability density function and conjectured that it was uniform and possibly random.
We made one assumption that will degrade the quality of random numbers that may be extracted from the uniform sequence. We conjectured that the apparently Gaussian signal had no skewness… that the number of values above the mean was roughly equal to the number below the mean and that 0 and 1 were equally likely to occur at any given point in our one bit uniform sequence. A given circuit may be – reproducibly – skewed in the same direction (weighted coin toss). To deal with this, the circuit must be tweaked to minimize the skew. In my circuit I tweaked the signal by varying the op amp gains and capacitor values using trial-and-error optimization.
Java Interface
We need to read serial data from the usb port from within our Java applications and we prefer a platform-independent approach. The JSSC library is used here. You can get the library and the javadoc by following the links at https://code.google.com/p/java-simple-serial-connector/.
Hardware random number application, ArduinoHRNG
The source code has 12 classes:
- Main.java, the application entry point that tests the port then creates an instance of the Acquire class.
- Acquire.java, a class that, when constructed, collects data, creates a uniform distribution, and runs a set of random number sequence tests. Provision in made for plotting and/or saving the data.
- AnalogPinReader.java, the class that uses jssc to read an integer array from the serial port.
- Signal.java, a container for integer signal arrays and statistical quantities that includes plotting methods.
- Utils.java, miscellaneous static methods
- Statistics.java, static methods for statistics computations used, excluding Chi square statistics
- ChiSquare.java, static methods for Chi square statistics
- RegressionModel.java, an enumeration used in plotting fit models
- CpuMatrixOps.java, used for linear regression
- FileOps.java
- PlotForm.java, a class that presents graphs
- Stopwatch.java, a timer
The application is written as a demo that is best run from an IDE. (If you do not use an IDE, then you can modify the main() method in a way that inputs the required parameters from the console.) To use the application, modify the global variables in the Main.java class as desired. The parameters to modify in the Main class are:
- portName: OS specific name for the serial port being used for the Arduino interface (e.g. Linux = “/dev/ttyACM0”, or Windows com3)
- isPlot: set to true at first.
- isSave; set to false at first
- rawSize: an integer that is used to compute the length of the raw signal to acquire. The length collected is rawSize*1024. To start, pick a value of 32, which should allow a completed test is under one minute.
- repeat: allows you to repeat the entire test n times. Start with 1.
- baudRate: an integer baud rate that is allowable in the Arduino sketch, the OS setting, and jssc. Set this value in all three places. A value of 115200 worked well in my experiments.
- maxValue: the upper limit for the random number sequence that you desire, e.g. 255 will give a set of values between 0 and 255. Use a value of 255 or greater. Start at 255 and Increment the value as desired, but make it one less than an even power of two, e.g. 255, 511, 1023, etc. The raw size parameter should be high enough to provide an expected value of at least 10 data points for each possible integer value in the sequence. For example, if I collect 32*1024 raw data points I get the following sequence lengths for an 8 bit example run (values vary from run to run):
- Raw data lengths = 40959 (larger than the expected value of 32768 because of the unpredictable nature of casting strings to integers in the application)
- Useful bit count = 40786 (lower than the raw signal length because the values at the mean are discarded)
- Uniform array length = 5098 (floor(40786/8) because we combine blocks of 8 single-bit entropy values to get a maximum possible value of 255
- Expected value for the number of points created for each unique integer (expected bin count) = 5098/256 = ~ 20.
- The rule is: if you want higher bit entropy in your sequence, you need to collect more data.
Output, Plots
The application will plot certain quantities if isPlot = true. Below are examples of the plots created.
Probability density function for raw data (Magenta = ideal Gaussian estimate):
Extracted random sequence:
Probability density function for random sequence (Red= regression line):
Output, Statistics
I began my experiments by collecting and saving byte arrays then testing the results with the ENT random sequence testing battery (http://www.fourmilab.ch/random/). In Java, I prefer to avoid casting 10 bit unsigned bytes to 8-bit signed bytes. In the application I collect integer arrays, so I created methods for the int[] type that perform tests similar to the ENT battery. Below is the console output for a rawSize = 256 (256 blocks of 1024 points) data set targeting a maximum random value of 1023.
Checking serial connection...
/dev/ttyACM0
OK
Test # 1... in progress
*****************************
Trial 1
Raw Data Statistics
count = 262144
mean = 508.73
Stdev = 89.68
min = 107
max = 937
# above mean = 130795
# below mean = 130045
above/below = 1.006
Uniform Distribution Statistics
Targeting values between 0 and1023
useful bit count = 260840
array length = 26084
mean = 512.53
standard deviation = 296.58
min = 0
max = 1023
# values at mean: 29
# values above mean: 13125
# values below mean: 12930
above/below: 1.015
Random sequence statistics
Entropy, bits: 9.962
1024 Bins created with an expected value of ~25
Chi Square Statistic: 1040.7
% of times randomly exceeded: 33.5
Passes Sedgewick's randomness test
Knuth (serial) Correlation: -0.00463
Monte Carlo computation of pi using the data: 3.12958
Monte Carlo relative error (%): 0.382
Using java.util.zip.Deflater
The size ratio compressed/original is: 1
------------done-------------
Statistics Interpretation
Before testing begins, a check is performed that lists available ports and attempts to collect data from the port the user specifies. After listing the ports it will throw an unfriendly error if the port is not correct.
Raw Data Statistics
- The count should be ~= ( rawSize )(1024).
- The mean should be ~= 512 (adjust with circuit offset trimmer).
- The standard deviation is adjustable with the gain trimmer.
- The minimum should be > 0 (adjust with gain trimmer).
- The maximum should be < 1023 (adjust with gain trimmer).
- The number of values above and below the mean should be approximately equal.
Uniform Distribution Statistics
- The mean should be near the midpoint of the desired range.
- The minimum value should be zero and the maximum value should be your target maximum (maxValue).
- The standard deviation should be ~= sqrt((n^2-1)/12), where n = [maximum - minimum +1]
- There should be roughly the same number of values above and below the mean.
Random Sequence Statistics
The entropy bits should be near to log2(maximum).
The Chi square computation casts the data into bins, each containing the number of occurrences of each value between the minimum and maximum. The expected value is the number of occurrences of a given value that would occur if the data was perfectly uniform. You want the expected value to be above 10 (some sources cite lower requirements). After the Chi square statistic is computed, a percentage which indicates how often a truly random sequence would exceed the Chi square statistic is calculated. Here are the guidelines for this percentage from the ENT website (http://www.fourmilab.ch/random/):
If the percentage is greater than 99% or less than 1%, the sequence is almost certainly not random. If the percentage is between 99% and 95% or between 1% and 5%, the sequence is suspect. Percentages between 90% and 95% and 5% and 10% indicate the sequence is “almost suspect”.
The percentage criteria should fail periodically (~5% of the time).
The Sedgewick's randomness test is another Chi square implementation. It is included for additional information. Again, it should fail occasionally.
The Knuth serial correlation measures the extent to which each value in the sequence depends upon the previous value. The statistic ranges from -1 to 1. Zero is ideal for a random sequence.
The Monte Carlo value should be near to pi. The value will improve as the length of the sequence increases.
The compression ratio should be near to one. Values lower than one indicate that the sequence can be communicated without transmitting the entire sequence.
If you want to see an example of failing tests, run the test with the Arduino serial pin disconnected. Consider a modification that runs the statistics tests on other random integer sequences like the ones that can be downloaded from http://www.random.org/integers/.
Multi-run Data
In the Main.java class you can set the repeat value to a number greater than 1. When you do, you can evaluate a set of sequences.
Below are some statistics for a 20 trial run where each collects a raw signal of 512X1024 values and targets a sequence with random values between 0 and 1023.
Number of sequences = 20 (each ~ 65K integers long)
| | Mean | Std Dev | Min | Max |
| Means | 512.82 | 1.40 | 510.38 | 515.36 |
| Standard Deviations | 295.85 | 0.50 | 294.61 | 296.88 |
| Minima | 0 | 0 | 0 | 0 |
| Maxima | 1023 | 0 | 1023 | 1023 |
| Balance ratios | 1.0004 | 0.0054 | 0.9925 | 1.0125 |
| Bit entropies | 9.978 | 0.002 | 9.974 | 9.980 |
| Serial correlations | 0.00074 | 0.00369 | -0.00749 | 0.00549 |
| Monte Carlo pi | 3.13725 | 0.00478 | 3.12646 | 3.14431 |
Frequency that a truly random sequence would exceed the Chi square statistic:
| | Occurrences |
| greater than 99% or less than 1% | 0 |
| between 99% and 95% or between 1% and 5% | 1 |
| between 90% and 95% or 5% and 10% | 2 |
Project Download
md5sum: 3c70aab5248e9beddf2142a4b366fb2f
Users will find that they can easily test and optimize the RNG by debugging the application in an IDE. I have tested the application using Eclipse (Helios and Luna) in both Arch Linux and Windows. Use the version 7 JDK.
The runnable jar is not very useful for experimenters, but can be run on a Linux machine that assigns /dev/ttyACM0 to the Arduino usb by changing to the runnable directory and executing:
java -jar ArduinoHRNG.jar
For Eclipse users, copy the entire unzipped ArduinoHRNG folder to your favorite projects folder and create a new java project with the exact name: ArduinoHRNG
The JSSC library is used in this application (https://code.google.com/p/java-simple-serial-connector/). To add the library to your project in Eclipse, right-click the project in the package explorer and choose properties. Select the Java Build Path navigation pane, go to the Libraries tab, and pick Add External JARs. From there, navigate to your jssc.jar file in the JSSC folder (in my case it’s jssc-2.8.0.jar). Select OK and close properties. Depending on your configuration, the library may already be linked in your project. I don't use any other IDE for Java development and can not recommend how to link to the library if you don't use Eclipse.
I use Arch Linux and I start my sessions by running stty -F /dev/ttyACM0 115200 in a terminal.
Follow the proper safety rules of electronics. Protect your Arduino from out of specification inputs. Experiment and have fun. Look for other natural random noise sources (I have seen one that uses a Geiger counter).
References
- Random Sequence Generator based on Avalanche Noise, http://holdenc.altervista.org/avalanche/
- Entropy and Random Numbers, https://calomel.org/entropy_random_number_generators.html
- Testing Random Number Generators http://www.cse.wustl.edu/~jain/cse567-08/k_27trg.htm
- ENT Random Sequence Tests, http://www.fourmilab.ch/random/
- How to calculate PValue from ChiSquare in Java, http://www.vvlasov.com/2013/06/how-to-calculate-pvalue-from-chisquare.html
- Art of Computer Programming, Volume 2: Seminumerical Algorithms (3rd Edition), Knuth, Addison-Wesley Professional; 3 edition (November 14, 1997), Chapter 3.3.2, http://www.amazon.com/Art-Computer-Programming-Volume-Seminumerical/dp/0201896842
- Characterization of Gaussian Noise Sources, Stephens, et. al. Robert Muro, NoiseCom, Inc., 2008
- White Noise Generator, Circuitry and Analysis, Sanchez, Univ. Texas San Antonio, 2008.
- www.phy.ilstu.edu/slh/chi-square.pdf
- Random Number Generation with a Simple Transistor Junction Noise Source, (Version 1 Revision 2. 22 June 2004), David Eather, 2003
- Why not simply use a floating pin? The Arduino as a Hardware Random-Number Generator, Kristenson, et. al., 2012. http://arxiv.org/abs/1212.3777
- www.physics.unlv.edu/~bill/PHYS483/op-amps.pdf
For the ambitious, a lifetime can be spent evaluating random number sequences. https://code.google.com/p/randomnumbertestsuite-nist/source/checkout
History
Keep a running update of any changes or improvements you've made here.
I am an analytical chemist and an educator. I program primarily to perform matrix computations for regression analysis, process signals, acquire data from sensors, and to control devices.
I participate in many open source development communities and Linux user forums. I do contract work for an environmental analytical laboratory, where I am primarily focused on LIMS programming and network administration.
I am a member of several community-interest groups such as the Prince Edward Island Watershed Alliance, the Lot 11 and Area Watershed Management Group, and the Petersham Historic Commission.


