Introduction
Windows applications sometimes crash on user side due to unpredictable reasons not being found during internal test. For many crashes, it is hard to figure out their root cause as they are not easy to re-produce or customer does not know how to reproduce.
And some crashes might be buried without being reported if they are not reproduced any more.
However, getting to know all those crashes and figuring out their root causes automatically should be helpful for us to improve our products and to grasp more about real user environments/user cases.
In this article, I’m going to provide a simple solution of monitoring Windows application crash, as well as enabling dump generation, automatically dump upload and analysis.
Solution Whole Picture
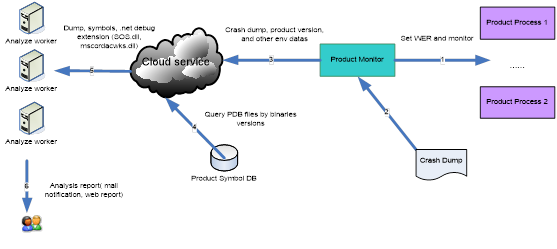
Pic 1 is the solution whole picture, we introduced a component------Product Monitor, which is simple, robust application responsible for monitoring product processes, collecting and uploading crash dump with environment information, etc.
Following the whole workflow:
- Product monitor sets Windows Error Report for those processes we are caring to generate crash dumps if they crash
- If a process exits abnormally, product monitor collects crash dump as well as other spot information including binary information, for managed application, that includes SOS.dll, mscordacwks.dll of .NET framework
- Process monitor uploads collected data in step 2 to Cloud Service
- Cloud Service queries product symbol DB for correct product symbols (this is quite important for those unmanaged application like products written in C++/C)
- Cloud Service allocates an analyze worker and sends the collected data with symbol files, an analyze worker is a Windows machine with debug/analyze tool like Windbg/CDB installed
- Analyze worker launches CDB command line to analyze crash dump and send the analyze result
Cloud Service is a cloud computing platform like Amazon EC2 or Microsoft Azure, but in my codes, a WCF application acts as Cloud Service for simplification.
Analyze workers could run on virtual machines or physical machines.
Pic 1
Solution Implementation
The attached source code provides a simplified implementation, it consists of the following components, shown in Pic 2.

Pic 2
Those components in green are built from attached source codes, those in blue are Windows components/features.
Crashed Program
Client.exe and NativeClient.exe are those processes to be crash-monitored, Client.exe is a managed program written in C# and NativeClient.exe is an unmanaged program written C++, I’m using memory access violation to make them crash for demo purpose, following are those codes making crash.
C#
char[] charArr = new char[10];
charArr[10] = 'a';
C++
char* p = NULL;
*p = 'b';
Sensor.exe
Sensor.exe is an Out-of-Process COM server written with C++/ATL, it’s running as an NT service. It acts the role of Product Monitor. Here I choose an Out-of-Process COM in the form of NT service because of the following considerations:
- Very easy for both managed codes and unmanaged codes to integrate
- Decoupling integration from the dependency of .NET Framework
- COM provides strong interfaces and versioning
- With NT service COM server, we needs just one Sensor.exe instance to monitor all processes, which is lightweight.
Sensor.exe provides only 1 interface IProcessSensor with 2 methods - RegisterProcess and UnregisterProcess.
interface IProcessSensor : IDispatch{
    [id(1), helpstring("Register a process with its ID")] HRESULT RegisterProcess(LONG ProcessID);
    [id(2), helpstring("UnRegister a process with its ID")] HRESULT UnregisterProcess(LONG ProcessID);
};
RegisterProcess enables Sensor.exe monitor whether a process has a crash happened.
RegisterProcess stops Sensor.exe from monitoring a process.
So if a process wants itself be monitored, for C#, it only needs adding 1 line codes.
new ProcessSensor().RegisterProcess(Process.GetCurrentProcess().Id);
For C++, it needs a little more code, it’s essentially C++ is much more complex to programmer than C#.
::CoInitialize(NULL);
SensorLib::IProcessSensor* pSensor = NULL;
HRESULT hr = ::CoCreateInstance(__uuidof(SensorLib::ProcessSensor),
NULL,
CLSCTX_LOCAL_SERVER,
__uuidof(SensorLib::IProcessSensor),(void**)&pSensor);
pSensor->RegisterProcess(::GetCurrentProcessId());
pSensor->Release();
::CoUninitialize();
Sensor.exe utilizes WER (Windows Error Report) to collect crash dump, when a process invokes RegisterProcess, sensor.exe will configure WER item in registry to enable dump generation for that process.
For more information about WER crash setting, please refer to this link.
After registration, Sensor adds the process handle into a monitored process handle array, and calls WaitForMultipleObjects on this handle array, if a monitored process exits, WaitForMultipleObjects will return, then Sensor.exe calls GetExitCodeProcess on the process handle of the exited process, if its exit code does not equal a predefined exit code (i.e., 0), Sensor.exe would think that process has exited abnormally, then goes to its dump folder defined in WER setting to check whether there is a crash dump generated.
The monitoring logic is implemented in CProcessWatcher::WorkFunc, actually besides waiting on those process handles, WaitForMultipleObjects also waits on another 2 events——stop and New-Process-Registration.
Stop event is used to notify Sensor.exe is about to stop, i.e., user stops service in Services.msc.
New-Process-Registration is used to notify a new process has registered for being monitored, in this case, Senser.exe stops WaitForMultipleObjects and adds the related process handle into process handle array, then starts waiting again.
Dump Uploader
If Sensor.exe has detected a crash, it launches DumpUploader.exe to collect and uploads crash dump.
DumpUploader.exe firstly checks the dump folder of the crashed program, which is configured in WER registry key, finds the latest dump, if crashed program is a managed application, it also collects SOS.dll and mscordacwks.dll, which are shipped within .NET Framework. That’s because for a managed application if its crash dump is analyzed on another machine rather than where the crash happened, SOS.dll and mscordacwks.dll on the spot are needed.
Those 2 DLLs could be found at %windir%\Microsoft.NET\Framework\vx.x.xxxx or %windir%\Microsoft.NET\Framework64\vx.x.xxxx, their location depends on the platform of crashed program, i.e., if it’s x86, the location is %windir%\Microsoft.NET\Framework\vx.x.xxxx, while if it’s x64 or AnyCPU and your windows is 64bit, then the location is %windir%\Microsoft.NET\Framework64\vx.x.xxxx.
If the crashed program is a native application (i.e., written in C or native C++), it does not need to collect SOS.dll and mscordacwks.dll.
DumpUploader.exe has the abilities of analyzing the image of crashed process, and deducing whether it’s managed or not, figuring out where to find SOS.dll and mscordacwks.dll if it’s managed.
Finally DumpUploader.exe packs all files into a zip (using Ionic.zip), and uploads it to server side through WCF service.
HostingService.exe
HostingService.exe acts as the cloud computing platform, it hosts a WCF service which is running as an NT service under NETWORK_SERVICE context, WCF service contract is defined in PrivateChannel.Interface project, and implemented in PrivateChannel project.
DumpUploader.exe invokes Upload() to upload dump package.
namespace PrivateChannel.Interface
{
    [MessageContract]
    public class UploadEvent
    {
        [MessageHeader]
        public string FileName { get; set; }

        [MessageHeader]
        public int Type { get; set; }

        [MessageBodyMember]
        public Stream FileData { get; set; }
    }

    [ServiceContract(Name="PrivateChannelServer",Namespace = "http://www.danhu.com")]
    public interface IChannelServer
    {
        [OperationContract(IsOneWay = true)]
        void Upload(UploadEvent e);
    }
}
After having received dump package, HostingService.exe launches Analyzer.exe for dump analysis.
Analyzer.exe
Analyzer.exe acts as the analyze worker, it firstly unpacks uploaded zip (using Ionic.zip), then checks dump type (Native code, managed code), then launches CDB.exe with command parameter –z for dump analysis.
If it’s a dump of managed application, it needs to tell CDB.exe to load uploaded sos.dll and mscordacwks.dll, supposing those 2 DLLs are placed in the same folder of dmp file, following codes constructs command parameters of CDB.exe:
string sosFile = Path.Combine(dmpPath, "SOS.dll");
string arguments = string.Format("-z {0} -y {1} -logo {2} -c \".load {3};.cordll
-ve -se -u -lp {4};!analyze -v;q\"",dmpFile, dmpPath, outputFile, sosFile, dmpPath);
Combined command line looks like below:
If it’s a dump of a native application, Analyzer.exe needs also retrieve those symbol files from symbol database and construct another CDB command line.
Current codes have just implemented the part for managed application, command line for native application dump analysis is much simpler.
As you see, analysis report will be output to a txt file, then Analyzer.exe could visualize the analysis report, by putting it on a web page, sending it to stakeholders via email, I have no web development experience at all, so I choose mail notification in my sample codes. Analyzer.exe.config includes CDB path and email settings.
Try the whole solution in your environment.
For a simple try, you just needs 1 machine which acts both client and server.
Client Side
- Put the client side components in one folder.
If you use Visual Studio 2010 to build the solution, all those client components would be put at %(SolutionDir)ClientDebug.
- Configure the WCF service endpoint in DumpUploader.exe.config:
Since we will use 1 single machine to act both client and server, set the endpoint IP 127.0.0.1 or localhost, however, if you want to try across different machines, please set the proper FQDN or IP here.
- Install Sensor service
Please run Sensor.exe /Service with administrator (launch cmd.exe Run As Administrator and execute Sensor.exe /Service), then you will see Sensor.exe in services.msc.
Server Side
- Put the server side components in one folder.
If you use Visual Studio 2010 to build the solution, all those server side components would be put at %(SolutionDir)ServerDebug.
- Configure the CDB path and email setting in Analyzer.exe.config:
-
CDB is the command line tool of windbg, if you do not have it installed, please install it firstly, it could be downloaded at Microsoft here.
- Configure WCF service endpoint address in HostingService.exe.config.
This should match that value in DumpUploader.exe.config.
- Install WCF service
The simplest way to install WCF service is using InstallUtil.exe, this tool is shipped within .NET framework, you could find it at where your .NET framework is installed, in my Windows 2012 standard with .NET 4 installed, its location is:
C:\Windows\Microsoft.NET\Framework64\v4.0.30319
Please execute InstallUti.exe /i C:\ServerDebug\HostingService.exe to install the WCF service, you could find it in services.msc after installation.
Start WCF Service
If you start it directly in services.msc, you might encounter the following errors.
That means NETWORK_SERVICE account does not have permission to start http server at localhost:8000, so please run the following command to grant NETWORK_SERVICE that permission firstly, this command also needs to be executed by administrator.
netsh http add urlacl url=http://+:8000/ChannelService/ user="NETWORK SERVICE"
Then Channel Service should be able to start successfully.
OK to Try!
Go back to client side (actually in the same machine J), and click client.exe, it will have itself registered to be monitored by Sensor.exe, then enter any key to make it crash, crash dump will be generated at C:\Windows\Temp\Client.exe.
Then wait a short while for packing and uploading finish.
On the sever side, the uploaded zip will be put at C:\Windows\ServiceProfiles\NetworkService\AppData\Local\Temp\Trap-yyyy-mm-dd-hhmmss, where yyyy-mm-dd-hhmmss is package receiving time.
After analysis is finished, you can find the analyze result AnalyzeResult.txt at C:\Windows\ServiceProfiles\NetworkService\AppData\Local\Temp\Client.exe.3776 (3776 is process ID of the crashed process).
If you enabled mail notification, your mail server work and you are the recipient, you would also receive the mail of analyze result, in which we can see client.exe got an Index out of bound exception.
Remarks
If crash application is built against .NET framework like client.exe, be sure that it’s built against .NET framework 4.0 or above.
My single machine environment is Windows 2012 standard, I think it should work on other Windows 2012 version.
I also tried it cross-machine, client is a Windows7, server is Windows 2012, it worked, but my two machines are in the same domain, if you want to try it across machines belongs to different domains, it should need some other WCF settings.
How to Use Code
This solution involves several Microsoft technologies, including ATL/COM, NT service, WCF programming, dump analyze, PE file check, etc.
Sensor project gives an example of writing ATL service.
DumpUploader project gives an example of WCF client, and method.
static bool ManagedPECheck() shows how to get the platform and CLR version of a managed application.
PrivateChannel.Interface and PrivateChannel show how to define and implement WCF service contract.
HostingService project gives an example of hosting WCF service within Windows service.
This solution could be built with Visual Studio 2010 or 2012, if you have build problem, please try to Launch Visual Studio with “Run as administrator”.
If you have client.exe build failed, please build Sensor.exe firstly, and then execute Sensor.exe /Service with Administrator context.
Then re-add COM reference Sensorlib.
Points of Interest
I once had trouble with uploading big files through WCF channel, but I have it resolved by the following settings in HostingService.exe.config.
History
- July 15, 2014 Initial post
Domain and interests include Windows system programming, network programming, high co-currency server, debugging skill, Microsoft technology integration, cloud computing.


 General
  News
News  Suggestion
  Question
  Bug
Bug  Answer
  Joke
Joke  Praise
  Rant
Rant  Admin
Admin 


