Table of Contents
- Introduction
- Background
- Required software tools
- Download links for software tools
- Quick look at the code
LIST_ENTRY memory layout and workingCONTAINING_RECORD working- Operations on
LIST_ENTRY - Using
WinDbg dt command to dump out MYSTRUCT structure using LIST_ENTRY - Using
WinDbg dt command to dump out all process in a live kernel - Using
WinDbg dt command to dump out all threads in a process in a live
kernel
Introduction
When we write software at the lowest possible level of an operating system,
more than often we do not have the extravagance of using fancy, well tested,
world renowned libraries like C++ STL, C++ Boost or something similar to that.
An outstanding example would be the Windows kernel, where the use of C++
itself is considered not the most optimal way of doing things, in favor of plain
old C to make things purely "bare metal" and have complete control and track of
what exactly we are doing, to the very last bit of instruction generated by the
compiler. This brings additional challenges, such as difficulty to maintain group of
items, where we could have used an STL vector, map or list in user mode.
To manage this, traditionally, OS developers use simple arrays, lists
and trees in OS kernel and among those, I cannot overemphasize the importance of
a typical doubly linked list which is ubiquitous in Windows kernel. In this
article, I am going to discuss LIST_ENTRY data structure which is used in Windows
kernel and other native parts of the Windows user mode, specifically ntdll.dll
to maintain a doubly linked list.
While this article shows its examples in the context of Windows OS, please be
informed that the exact same techniques are used in Linux, BSD as well, wherever applicable
with different variable and macro names. As a matter of fact, the concepts which
are discussed here, are running in your system, at the very moment, even when you
are reading this article, irrespective of which OS you are using (Mac, Linux, Windows) or the version of that OS.
The code, which is available for download, demonstrates the usage of LIST_ENTRY and CONTAINING_RECORD in a simple scenario. This code is used for debugging with WinDbg to demonstrate dt (dump type) command to dump out the structure. Latter part of the article describes how to use the techniques specified in the former part for live Windows kernel debugging to dump out the list of all processes and then all the
threads inside a specific process.
I suggest you take a look at the code first and keep it open while reading the article because I have tried explaining the concepts with reference to the source code.
Also, readers of this article are expected to know C programming language.
Background
To understand LIST_ENTRY structure and CONTAINING_RECORD macro and their usage, a thorough understanding of pointers and structures is essential. The documentation for LIST_ENTRY and CONTAINING_RECORD are available at ListEntry and
ContainingRecordMacro respectively. A headstart on WinDbg could also help with the debugging.
This article is based on the following 4 presentations, so feel free to refer to them to
brush up your prerequisites:
Required Software Tools
The tools used are:
- WinDbg, preferably latest - for debugging
- VmPlayer -
For running the target Virtual Machine which is being debugged
- An OS - to be installed in the VmPlayer
WinDbg and VmPlayer are available for free download. Now I have used Windows 7 for VmPlayer, however you could use whatever you have got provided it's something over Windows 2000.
Also, you don't have to stick with vmplayer. You can go with any virtualization
infrastructure which supports kernel debugging in Windows.
Download Links for Software Tools
Make sure you download the latest version of
VMPlayer.
Let's Have a Quick Look at the Code
As mentioned before, please open the attached code in your favorite editor. The code contains a sample structure, MYSTRUCT that used LIST_ENTRY as a part of it. The definition is similar to that in the header file wdm.h.
The user defined structure in the code is the following:
typedef struct newstruct
{
int num1;
int num2;
char alpha;
LIST_ENTRY list_entry;
float exp;
}MYSTRUCT,*PMYSTRUCT;
...
The structure of LIST_ENTRY is as follows (explained later):
typedef struct _LIST_ENTRY
{
struct _LIST_ENTRY *Flink;
struct _LIST_ENTRY *Blink;
}LIST_ENTRY,*PLIST_ENTRY;
...
The CONTAINING_RECORD macro is defined as follows in the beginning of the code
(explained later):
#define CONTAINING_RECORD(address, type, field) (\
(type *)((char*)(address) -(unsigned long)(&((type *)0)->field)))
...
We have just seen all the important players in the game. Now, there are just two operations defined in the code, namely
<a href="http://msdn.microsoft.com/en-us/library/windows/hardware/ff547799(v=vs.85).aspx">InsertHeadList</a>
and
<a href="http://msdn.microsoft.com/en-us/library/windows/hardware/ff547799(v=vs.85).aspx">InitializeListHead</a>
whose definition is similar to that in
wdm.h. In the
main function, I have just added two entries to the list. And later accessed a member(
num1) of the structure
MYSTRUCT by traversing
LIST_ENTRY and calculating the starting address of
MYSTRUCT using
CONTAINING_RECORD.
So the code is as simple as adding 2 nodes to a doubly linked list and reading them
back.
LIST_ENTRY Memory Layout and Working (With Respect to the Source Code)
Now, let us try to understand the memory layout of the list and how it works.
LIST_ENTRY normally appears in the middle of a structure. It contains a Flink and Blink pointing to forward and previous LIST_ENTRY structure which is a member of another structure (in the source code, it's MYSTRUCT).
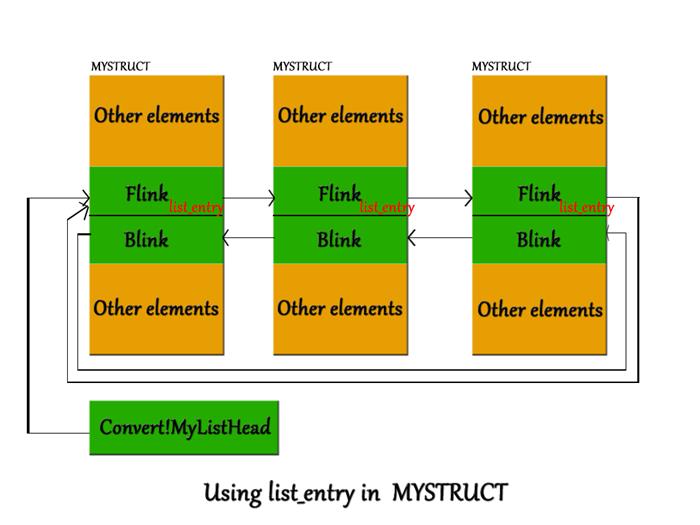
In the above figure, you can see list_entry (refer to MYSTRUCT declaration in the previous section) is of type "LIST_ENTRY" and it appears in the middle of the structure MYSTRUCT. Also, note how each object of the structure is linked. Not using a pointer to MYSTRUCT, but via a pointer to LIST_ENTRY. Now this also means, you cannot directly access the member of the structure because your object is pointing to the start of LIST_ENTRY structure and not MYSTRUCT. So you have to calculate the start address of MYSTRUCT from the address of list_entry (which is the one you have at hand). For this purpose, the macro CONTAINING_RECORD is used.
For example, if you wish to access num1 of MYSTRUCT, you cannot access it directly, but rather calculate the offset first, get the start address of MYSTRUCT and then access the element. And that is exactly what the source code does.
CONTAINING_RECORD Working (With Respect to the Source Code)
Now let's have a look at CONTAINING_RECORD. CONTAINING_RECORD declaration might seem complicated at first look. However the working is pretty simple. Let's take a look at the arguments it takes.
address: This is nothing but a pointer to a field (here,list_entry) in an instance of a structure of type Type (here, MYSTRUCT).type: The name of the type of the structure (in the source code, it is MYSTRUCT whose base address is to be returned, from which direct access to structure members can be made.field: The name of the field (in this source code, it is list_entry) pointed to by address (first argument of the macro) and which is contained in a structure of type Type (MYSTRUCT)
Still complicated? Let's dig deeper. Let us take a look at the definition again.
#define CONTAINING_RECORD(address, type, field) (\
(type *)((char*)(address) -(unsigned long)(&((type *)0)->field)))
...
Let's take a closer look at this part of the macro definition
(&((type *)0)->field)
It seems, we are trying to access a field from null pointer. That is, the
above statement itself will cause a problem. In fact, the whole expression is not
completely inline with the C standard although it works in almost all known
compliers. Let us try to have a logical understanding of what is going on. Now, as
you can see, the null pointer is typecasted to a pointer to type (in this case, MYSTRUCT). Trying to refer to a field wouldn't generate any access violation error
and in fact the '& 'in front of it is doing that trick, because we aren't exactly accessing that memory location, but just
address of it. So it would return the offset of the field that we are referring to (in the source code, it is list_entry).
So in another words, it gives address of field element in the type
when the type's object address is null. Now that we know the offset of LIST_ENTRY structure inside MYSTRUCT, we just need to subtract this offset from the address (first argument of the CONTAINING_RECORD), to get the starting address of the containing structure (in the source code, containing structure is MYSTRUCT).
Thus, CONTAINING_RECORD(temp,MYSTRUCT,list_entry)->num1 in the source code would refer to num1 of structure MYSTRUCT.
Explanation of while loop in the source code that uses CONTAINING_RECORD
PLIST_ENTRY temp=0;
temp=MyListHead;
while(MyListHead!=temp->Flink)
{
temp=temp->Flink;
int num1=CONTAINING_RECORD(temp,MYSTRUCT,list_entry)->num1;
printf("num1=%d\n",num1);
}
The function of the loop above, as it appears in the source code, is to print each value of the member num1 in the structure MYSTRUCT. The traversal of the list is performed using list_entry of MYSTRUCT. temp is an element of type LIST_ENTRY which is initialized to MyListHead (which points to the first list_entry within the structure MYSTRUCT, in a list of elements of type MYSTRUCT). The condition in the loop checks whether the end of list has been reached. temp=temp->Flink is used to traverse to the next element in the list. However, note that Flink will be pointing to list_entry within the MYSTRUCT and not the start of the structure. But we have to display the value of num1. For the aforementioned purpose, the next line in the source code (int num1=CONTAINING_RECORD(temp,MYSTRUCT,list_entry)->num1; ) is used. The working of COTNAINING_RECORD was explained earlier. Please do refer to it to see how the macro works.
Operations on LIST_ENTRY
Though there are a number of operations on LIST_ENTRY, the source code covers just two functions,
the rest of the functions are available in wdm.h for your reference. In this section, let us try to
understand how LIST_ENTRY operations works and its polymorphic significance,
Initializing the List Head ( InitializeListHead(PLIST_ENTRY Listhead))
The definition of InitializeListHead(PLIST_ENTRY Listhead) is as follows:
void InitializeListHead( PLIST_ENTRY ListHead)
{
ListHead->Flink = ListHead->Blink = ListHead;
}
In the above function, since it's a doubly linked list, we're initializing the Flink and Blink. Also Both Flink and Blink points to ListHead. That is, this is a circular doubly linked list.
Inserting New Node ( InsertHeadList( PLIST_ENTRY ListHead, PLIST_ENTRY Entry))
The definition of InsertHeadList( PLIST_ENTRY ListHead, PLIST_ENTRY Entry) is as follows:
void InsertHeadList( PLIST_ENTRY ListHead, PLIST_ENTRY Entry)
{
PLIST_ENTRY Flink;
Flink = ListHead->Flink;
Entry->Flink = Flink;
Entry->Blink = ListHead;
Flink->Blink = Entry;
ListHead->Flink = Entry;
}
The function takes two arguments, one of which is the listhead (MyListhead in the source code) and the other is the list_entry (which is a member of the structure MYSTRUCT).
The function adds the new element to the front of the head list, pushing behind the
existing element behind, otherwise the code is self explanatory.
The Polymorphic Nature of LIST_ENTRY and Related Functions
An interesting point to note is that the above mentioned functions take argument of type pointer to
LIST_ENTRY and NOT a pointer to MYSTRUCT. This means that these functions are independent of the type of structure with which it is used,
because the definition is independent of that structure type (In the source code, it is MYSTRUCT).
This polymorphic nature of these constructs allows us to use this with any
TYPE, and not worry about their layout at runtime. From a programming standpoint,
this is as good as C++ templates if not better, without any code duplication
like in the case of C++ templates.
Using WinDbg dt Command to Dump Out MYSTRUCT Structure using LIST_ENTRY
Now let us have a look into the debugger and do some practice with the code. As
you can see below, Debugger commands are equipped to deal with LIST_ENTRY.
Please follow the below instructions to do this exercise. This is needed for
the coming section of this article.
Open the given source file (Convert.cpp) in WinDbg. Also open the executable (Convert.exe) from the project folder in WinDbg. Set a breakpoint in line 89, or where the while loop begins in the source code. Now you can dump out the structure with the following commands:
- Type the command x Convert!MyListHead in the debugger.
- The address of
MyListHead will be dumped out on the left. - Type the command dc address ( any d* of your choice should work) (The address from step 2) in the debugger. Do another dc address (The first address on the left of previous dc output).
- The first address is the address of the
LIST_ENTRY structure in MYSTRUCT. - The offset of
LIST_ENTRY structure (list_entry field) in MYSTRUCT have to be subtracted from the address in the previous step to get the starting address of MYSTRUCT. - The offset can be obtained by dumping out
MYSTRUCT with the command dt Convert!MYSTRUCT - Subtract the offset of
list_entry from the address in step 4 with the command ?addr-offset - Now use the obtained address with the following command to recursively list the entries of
MYSTRUCT
- Syntax: dt type -l field.Flink address
- Command:
dt Convert!MYSTRUCT -l list_entry.Flink addr from previous step
If you're finding difficulties in the steps, please refer to the images below. It is the sequence of commands and equivalent output from WinDbg for the attached demo project's executable.

Now we are ready to look at some real production OS scenarios, in
which LIST_ENTRY is used.
Using WinDbg dt Command to Dump Out All Processes in a Live Kernel (like
!process output)
Follow the steps to create a named pipe and use it to attach the virtual machine to debugger for live kernel debugging of the OS within the virtual machine:
- Download and install VmPlayer (See to "Download Links for Software Tools" for download link)
- Install a target OS in VMPlayer. I have installed Windows 7.
- Add a virtual serial port in VM player.
- Open VmPlayer
- Select the OS installed on the left pane. It's properties are displayed on the right pane.
- Click Edit virtual machine settings
- In the opened dialog box, under Hardwaretab, click "Add"
- Select the hardware type as "Serial Port" and click Next
- Select "Output to Named Pipe" in the next window and click Next
- Enter a name for the pipe. (I have given "
\\.\pipe\NamedPipe" as the name.) Make sure you have it copied somewhere. You need to remember that. Click Finish. - Select "Serial Port" under the "Hardware" pane. Its properties appear on the right pane.
- Enable Use named pipe radio button. Enter the name as the one you have given earlier. Click Ok.
- Now start your virtual OS. (Click on "Play Virtual Machine".)
- Open the "Run" command prompt. Type msconfig
- "System Configuration" dialog box opens.
- Under the "Boot" tab, Click on "Advanced Options" and enable
Debug checkbox. Click Ok.
- Open the WinDbg in your host machine.
- Select File->Kernel Debug
- In "Kernel Debugging" window that opens, under "COM" tab, enable Pipe and
Reconnect checkbox. Enter the pipename you have created in the virtual machine (for me, it was
\\.\pipe\NamedPipe ). Click ok. - Now the Kernel Debugger waits for the pipe to reconnect. Restart your virtual machine. And the target OS (the one in the virtual machine, the debugee) will be connected to the debugger.
- Once connected, and when you see the message "
KDTARGET : Refreshing KD connection " on command window, hit break after which commands can be executed.
Live debugging to list all processes
Now that the target OS is connected to the debugger, we can dump out all the current running processes in the target OS (inside the virtual machine) using dt command. The steps are similar to how we dumped out
MYSTRUCT earlier. Instead of Convert!MyListHead, we're going to use
nt!PsActiveProcessHead. PsActiveProcessHead is a pointer to the start of the kernel's list of
_EPROCESS structures. _EPROCESS structure has a member named
ActiveProcessLinks which is of type LIST_ENTRY. Using this member (ActiveProcessLinks), we can dump out a list of all active processes in the kernel using dt command.
- Type the command x nt!PsActiveProcessHead in the debugger.
- The address of
ActiveProcessHead will be dumped out on the left. - Type the command dc address (The address from step 2) in the debugger to see the contents of
ActiveProcessHead. The first address is pointing into a structure which is of type
_EPROCESS - The offset of
ActiveProcessLinks in _EPROCESS have to be subtracted from the address in the previous step to get the starting address of _EPROCESS. - The offset can be obtained by dumping out
_EPROCESS with the command
dt nt!_EPROCESS - Subtract the offset of
ActiveProcessLinks from the address in step 3 with the command
?addr-offset - Now use the obtained address with the following command to recursively list the entries of
_EPROCESS
- To dump out specific fields inside the
_EPROCESS structure, say for example the ones starting with "Thread", use this command..
dt nt!_EPROCESS -l ActiveProcessLinks.Flink -y Thread addr
.
The following snapshots would make it easier to follow.
Now that we got all the processes running in a Windows OS. Now let's try dump
all the threads inside one of these processes.
Using WinDbg dt Command to Dump Out All Threads in a Process in a Live Kernel
To dump out threads from a particular process is pretty straight forward and similar to dumping out all the active processes. _EPROCESS has a member named ThreadListHead which will be pointing into a structure
list called _ETHREAD. ThreadListHead is of type LIST_ENTRY whose Flink points to ThreadListEntry inside the _ETHREAD structure. Once the explained idea is clear, the process should be easy.
- For demo purposes, assume you have one of the addresses of active process (with handle count>0) copied.
- Dump out the
_EPROCESS structure at that address using dt command to find the offset of ThreadListHead - Copy the first address within the parenthesis of
ThreadListHead entry in the dumped out structure. This will be pointing into _ETHREAD - The offset of
ThreadListEntry in _ETHREAD have to be subtracted from the address in the previous step to get the starting address of _ETHREAD - The offset can be obtained by dumping out
_ETHREAD with the command dt nt!_ETHREAD - Subtract the offset of
ThreadListEntry from the address in step 3 with the command ?addr-offset - Now use the obtained address with the following command to recursively dump out all active threads
- Syntax : dt type -l field.Flink address
- Command :
dt nt!_ETHREAD -l ThreadListEntry.Flink addr from previous step
The following snapshots would make it easier to follow.
Key Points of Interest
There are few interesting points that need to be noted as these would definitely make things go wrong if not understood properly.
CONTAINING_RECORD takes the address of a structure member and returns the starting address of the structure.dt command takes the start address of the structure to dump out its contents
not the address of a structure member as in the case of CONTAINING_RECORD.- The dump of process can be done with
!process command and thread with
!thread
command both commands internally use the same technique which we have just
discussed. You can use those commands to verify your output.
My name is Meena. I am a Computer Science grad student at Georgia Institute of Technology. I like talking about distributed systems, sustainable living and interactive intelligence.


 General
  News
News  Suggestion
  Question
  Bug
Bug  Answer
  Joke
Joke  Praise
  Rant
Rant  Admin
Admin 


