Introduction
Perhaps your program requires the graphic presentation of any 2D math
expression. In this case you may need a set of classes that will perform this
task without complications. Normally you have to think about scaling, layout of
the curve, how to set the divisions on the axis, problems with infinities etc.
and the graphic representation may become easily an important and tedious part
of your project.
Plothelp was created to do all this in the easiest way for you. You just need
to introduce 4 lines into your code: one line defines the formula as a string,
other two lines define the starting and the endpoint of the x-range and finally
you may indicate the number of points to form the curve.
The rest is automatic. Plothelp will scale both axes, set the corresponding
divisions, draw the corresponding xy-gridlines and finally draw the curve.
Also, it is often desirable to draw math functions using different signs in
order to complete the presentation of the function.
y= sqrt(x) is such an example. Plothelp offers the possibility to use the ±
operator drawing both options in the same graph. Just write ±sqrt(x) instead of
sqrt(x) and it will work. You may use this operator in your formula as often as
you like.
Formulas as y = ±x ±1 will result in a graph with 4 curves. The scaling of
the y-axis will be adapted to all curves at the same time.
The downloadable demo-exe permits you to write formulas to the console and to
represent them by Plothelp. This gives you an impression how the representation
would fit in your project.
Using the code
Plothelp is embedded in only three classes, which are dedicated to the layout
of the Form, the drawing and the math operations. Also, info.lundin.Math.dll
is necessary to parse the formula string. Do the following steps:
- In your project, under the Project menu, add the following 3 files:
- CurveCalc.cs
- GraphPlot.cs
- Plotter.cs
- Select the Add Reference option and use the Browser option to find
the file info.lundin.Math.dll and click OK. This will include the functionality
of the formula parser.
- Add the directives
using DataPlotter;
using System.Windows.Forms;
using System.Drawing;
to the header of the class from where you will call Plothelp.
- Now you are ready to use Plothelp in your project. Just add the following
lines where you need it, p.e:
First, the formula is defined as a string taking only the right hand side of
the equation. In the above example
y = x^2 + 3*x - 4 is used.
Second, define the range indicating the starting point and the end point as
double.
Third, define the number of points to be represented as int. Normally,
100 or 200 points are sufficient. Perhaps in certain cases you may want to study
details with better resolution increasing this number.
Finally, call GraphPlot passing the variables exactly as indicated.
You should see the graph shown below.

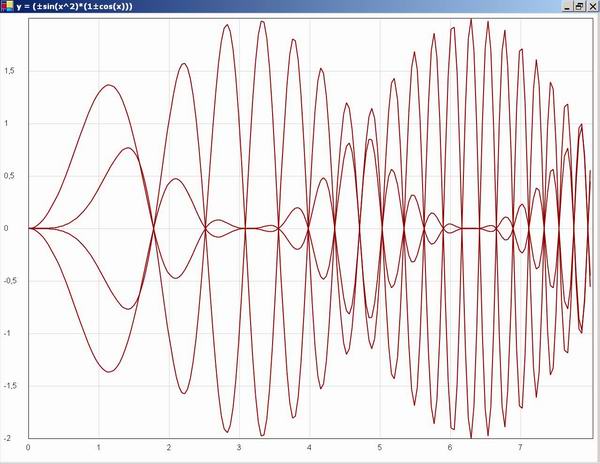
The next graphs show the multiple use of the ± operator in the function
y = +sqrt(x)+sin(x)
for the range –1 to 8 when the + sign is replaced successively by the ±
operator.
Fig 2: :y= sqrt(x) + sin(x) y= sqrt(x) ± sin(x) y= ±sqrt(x) ±
sin(x)
How it works
Plothelp produces a matrix for n points of a function:
x0 , y0
x1 , y1
: :
: :
xn-1 , y n-1
However, first the formula is checked for the presence of the ± operator in
the formula string.
If it exists, it’s position(s) in the string are stored in an array and then
successively the operator is replaced by “–“ and by “+” in the formula
calculating each time a new column in the amplified matrix
x0, y10 …. yk0
x1, y11 …. yk1
: :
: :
xn, y1n .... ykn
where k is twice the number of ± operators present in the formula.
Based on the matrix, first for the x-range and then for all y-ranges, the
divisions (ticmarks) of the axes are calculated and stored in arrays. Then the
axes with the ticmarks are drawn and labelled.
The values for each ticmark are first checked by a special method Rndhlp in
order to avoid rounding errors (as p.e. 2.3650000000001*E-13) and works also for
exponential notation. Basically, the number is converted into a string, the
exponential part –if any- is cut off and the remaining number is treated. If
this value is >1 then the sequence of digits is cut at the 5th
position behind the coma and the exponential part is added again. However, if
the value is <1 then the first digit different from 0 is found and the coma
is placed behind. Now again, the sequence is cut at the 5th position
behind the coma. As the shift of the coma equals a multiplication by
10n this is taken in account when the possible exponential part is
added again.
To draw the curve g.DrawLine(penDraw,Point1,Point2) is
used. This means that the entire curve is really a point-to-point construction
of tiny straight lines and this may originate some problems in the
representation of certain curves. Imagine for example a circle expressed by the
function y = sqrt(1-x2) in the range from –2 to +2. As the curve
drawing takes place from left to right first it is necessary to identify the
point where the curve starts.
This is done by the method FirstNumber() of the class CurveCalc
that checks the matrix point by point returning the index of the first position
giving a finite y-value. In our example of the circle this should correspond to
the point –1,0.
However, if you tried to present the curve in 103 steps for example, the
first real point will be between point 25 at x = -1.0196 and the next calculated
point at x=-0.980 where the function gives already a value. That means that you
did not find the true start of the curve. In such a case you would obtain a
circle that is “open” at the beginning (and also at the end).
To avoid such type of problems the method CurveStart(int column)
is used. The method looks for the first x-value giving a finite y-value (firstX)
and starts iteration between this point and the previous point to find the start
of the curve.
public double CurveStart(int column)
{
int j,t=column;
double firstX=0,foreX=0, z=0;
double increm=(xn-x0)/nump;
double y;
bool ynum, yinf;
y=curve[0,t];
ynum=Double.IsNaN(y);
yinf=Double.IsInfinity(y);
if(ynum==false & yinf==false)
{
return x0;
}
else
{
for(j=1;j<=nump-1;j++)
{
y=curve[j,t];
ynum=Double.IsNaN(y);
yinf=Double.IsInfinity(y);
if(ynum==false & yinf==false)
{
firstX=curve[j,0];
foreX=curve[j-1,0];
break;
}
}
}
if(yinf==false)
{
for(int k=0;k<50;k++)
{
z=foreX+(firstX-foreX)/2;
if(Double.IsNaN(yValue(z,t))==true)
{foreX=z;}
else {firstX=z;}
}
}
return firstX;
}
For certain type of functions an increase of the iteration factor k may be
useful.
In a similar manner the method CurveEnd
(int
column)
is used for the end of the circle. column refers to the
column in the xy-matrix that corresponds to the current curve.
Limitations
There are also some rare cases where Plothelp cannot work properly. This
happens for example when the curve forms several closed regions within given the
x-range. Look on the following graphs representing the function
y = ±sin(x)2/x
Fig 3: x-range from 6 to 10 x-range from 6 to 16
As you may see the methods looking for the start and the end of the region do
not work between regions and for this reason the last point of the first region
is connected to the first point of the second region by a straight line that
does not represent the function.
Points of Interest
Did you ever try to program automatic division of the axis? It looks easy in
the beginning but it took me quite a long time to make it work well. Now it
seems so simple!
public ArrayList AxDiv(double xa, double xs)
{
if(xa==Double.NegativeInfinity){xa=-100000;}
if(xs==Double.PositiveInfinity){xs= 100000;}
double diff=xs-xa;
double num=diff/10;
int redw=(int)Math.Floor(Math.Log10(num));
double tlg=Math.Pow(10,redw);
ArrayList tic=new ArrayList();
if(diff/tlg<11){tlg=tlg;}
else if(diff/(2*tlg)<11){tlg=2*tlg;}
else if(diff/(5*tlg)<11){tlg=5*tlg;}
else {tlg=10*tlg;}
if(xa/tlg==Math.Round(xa/tlg))
{
tic.Add(xa);
}
else
{
tic.Add(Math.Floor(xa/tlg)*tlg);
}
while(Convert.ToDouble(tic[tic.Count-1])<xs)
{
tic.Add(Convert.ToDouble(tic[tic.Count-1])+tlg);
}
return tic;
}
History
This was my first program in C#. I am sure that you may find a lot of things
that are improvable. To shorten the effort I took a part of a nice program
written by Hans-Jürgen
Schmidt: DataPlotter - linear or logarithmic display of 2D data which has
been available through the CodeProject.
Another great help was the formula parser written by Patrik Lundin (see http://www.lundin.info) which works
very well and saved me a lot of time. If you want to be informed about the rules
of the syntax of the formula parser it’s a good idea to visit this site.
My sincere acknowledgement to both authors.
This member has not yet provided a Biography. Assume it's interesting and varied, and probably something to do with programming.


 General
  News
News  Suggestion
  Question
  Bug
Bug  Answer
  Joke
Joke  Praise
  Rant
Rant  Admin
Admin 


