Introduction
Over a decade ago, my colleagues and I wrote two books on using different tests for examining the assumptions of time series analysis in both the univariate and multivariate contexts. Back then, the programs to conduct these tests were a mixture of Basic, C, and the use of some batch programs in commercial packages such as RATS, SHAZAM, and TSP.
- Cromwell, J.B., M.J. Hannan, W.C. Labys, and M. Terraza. 1994. Multivariate Testing for Time Series Models. New York: Sage Publication.
- Cromwell, J.B., W.C. Labys and M. Terraza. 1994. Univariate Testing for Time Series Models. New York: Sage Publications.
Today, other packages such as SAS, SPSS, Ox, Matlab, and S-Plus can be used to do similar work. However, a favorite open source statistical package of mine was and continues to be developed by researchers at Carnegie Mellon University, known as the statistical language R. The R language can be downloaded from here. Once installed, go to the Package menu in R and select all the packages, and hit Enter. This will install all the libraries so that the baseline Splus and R are the same. R uses the S language, and Fox (2002) and Farnsworth (2006) provide excellent references for doing the time series analysis mentioned in my two books. In a series of papers, I plan to demonstrate using R and C#.NET for a wide variety of statistical and analytical applications that can be built in a typical 3-4 hours of work.
Background
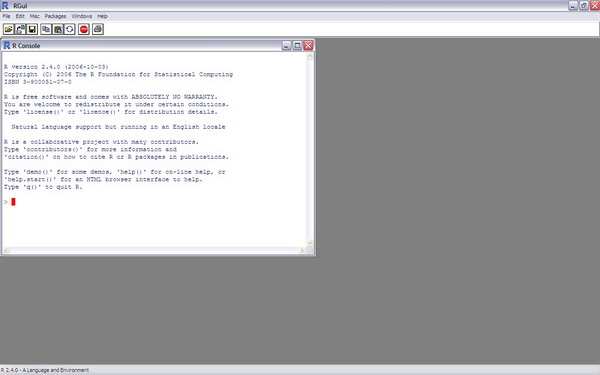
Besides using the GUI shown in Figure 1, I wanted to be able to use R as an intelligence component in my research applications. At the University, publication for applied work is always going to need the latest statistical techniques, and for this, a programming language. Because of my background in both .NET and Java, I chose to use C#.NET for the interface language to build these middleware pieces. I downloaded Microsoft Visual C# 2008 Express Edition, and wanted to attach the references for the R .NET component to begin the work of this middleware application. Since there was not a .NET component bundled with R, I used the R-(D) COM interface for the automation.
Figure 1. The GUI interface to R
R in .NET - The R(D) COM interface
The R-(D) COM interface is a COM server that can connect to applications such as Microsoft Excel to take advantage of the statistical techniques that are constantly being added to the R releases. In addition, there are ActiveX controls that can be included in the application. Thus, data can be transferred in and out of R, and Visual Basic, C#, and Perl can serve as COM clients that enable one to use R as a computational engine that also can render graphics. The COM server can be downloaded and installed by following these steps:
- Go to cran.r-project.org
- Choose "Other" item from the Software menu
- Choose R-(D) COM Interface (for Windows)
- Choose RServer250.exe
- Install the application
Once installed, you can add the following COM references to your C#.NET project, as well as these namespaces to your class:
using STATCONNECTORCLNTLib;
using StatConnectorCommonLib;
using STATCONNECTORSRVLib;
Each of these type libraries uses the .NET interoperability feature for operation. Use the using statements in the code.
The code to use the .NET component as an interface to R is quite simple, and has only a few statements that can execute data in, process it, and then extract it. For example, to generate twenty random normal numbers, one uses:
object o1;
int n=20;
StatConnector sc1 = new StatConnectorSRVLib.StatConnectorClass();
Sc1.Init("R");
Sc1.SetSymbol("n1",n);
Sc1.Evaluate("x1<-rnorm(n1)");
O1=sc1.GetSymbol("x1");
Xrnd=(double) o1;
Once we instantiate the class with sc1 and initialize R, we can then generate data with a declaration of n1 as the object type in R and n to be the integer type - the number of normal random numbers we want to generate. The SetSymbol() function is used cast the C# type to an R type. Then, we can use the GetSymbol() function to get the variable, and then cast it to an object for processing. For more understanding of the R data types, examine the help documentation that comes with R.
Importing the data
While we can generate data within R, it would also be instructive to import data into R. For example, you can read data from more than one data format. The most common format is a text file, with data separated into columns, with a header for each column. I created a list of numbers, one in each line, in Notepad, to import into R. This chooses the file through a dialog.
>mydata = read.table( file.chooseO, skip = 1 )
The file.choose() function provides the dialog to choose the text file, and the skip=1 parameter says to skip the first line for the Header value. The R variable is mydata and the name of values is V1. To see the data:
>mydata
In the dialog window, the values are shown for the variable V1. Suppose, I would like to read in these data values into a variable that represents a yearly time series that represents a stock’s values:
>zl <-ts(mydata,start=c(1992,8), 1)
>plot(zl)
I can use the following ts() function that starts with the year 1999, with the frequency being yearly. Of course, I can plot these numbers to verify as well as look at the values of z1. Now that we can do this in the R application, how do we do this in C#.NET and not use the R Windows interface? Importing can be problematic when taking the expressions directly over to C#, so I use a traditional text file or database work to populate the variables and then use the SetSymbol() function to import the values into R and then do transformations. However, we can use the EvaluateNoReturn() function to read in the data with:
Sc1.EvaluateNoReturn("m1=read.table(file.choose())");
The difference between Evaluate() and EvaluateNoReturn() is that the former returns the reference to an object, which is necessary when casting and extracting data from the R environment. As a rule, this is how I prototype and test my statistical components, write them for execution in the R Windows interface, save them to text, and then read the file one line at a time with one evaluate function. Then, you can modify the text files, or combine multiple text files for statistical processing. This provides for a very creative modeling and analytical environment. Besides the computational aspects mentioned, one can also render graphics through the using statement:
using STATCONNECTORCLNTLib;
The R graphics device
The code to generate a histogram plot of twenty normal random variables is provided by:
StatConnector test1= new STATCONNECTORSRVLib.StatConnectorClass();
test1.Init("R");
test1.Evaluate("x<-rnorm(20)");
test1.EvaluateNoReturn("hist(x)");
The R graphics device populates its own dialog window with the histogram results. This nice feature automatically provides additional graphical resources and libraries for doing 2D and 3D charting. The dialog window permits the ability to save in a variety of graphics format, print, and save to the clipboard. Furthermore, you can examine the history and resize options. Again, refer to the R documentation for the necessary expressions and packages.
Figure 2. Histogram of normal random numbers

As one can see, an understanding of the R language and the use of the bundled packages permit the opportunity to build a business forecasting or analytical application quickly. Download some stock data from Yahoo!, and throw it into SQL Express and use LINQ for the OEM, and reference the R COM component, download some packages, and forecast some stocks using the latest methods in time series analysis. This is the subject of Part II of the series.
Conclusion
Using the open source R statistical language is a good way to incorporate the latest statistical research into your business intelligence prototypes and applications, as it presents a low cost alternative for the development and implementation of statistical algorithms for predictive analytics not available in standard commercial packages. I have used R in this fashion for doing wavelet analysis for price analytics, watershed modeling for acid mine drainage, and for stochastic volatility modeling of stocks using Bayesian Markov Chain Monte Carlo (MCMC) techniques. In future articles, I plan to show how to build these types of applications in 3-4 hours of programming work.
References
- Farnsworth, G.V. (2006), Econometrics in R.
- Fox, J. (2002), An R and S-Plus Companion to Applied Regression, Thousand Oaks, CA: Sage Publications.
Dr. Jeff B. Cromwell is the CEO/Neuroeconomist at The Cromwell Workshop.
Scholar Site: http://independent.academia.edu/JeffCromwell
Web Site: www.cromwellworkshop.com


 General
  News
News  Suggestion
  Question
  Bug
Bug  Answer
  Joke
Joke  Praise
  Rant
Rant  Admin
Admin 


