Introduction
Drawing charts or graphs is a very common requirement for many projects. If you have been working as a software professional, you must have come across the situation of drawing charts. Most of the time, we tend to rely on third party controls which are costly.
Background
I am going to demonstrate .NET’s in-built function to draw some basic charts. At the end of the article, you should be able to draw basic charts in your Windows application. I am using C# here.
Using the Code
I created a Windows application and wrote the following four functions to handle four different types of charts.
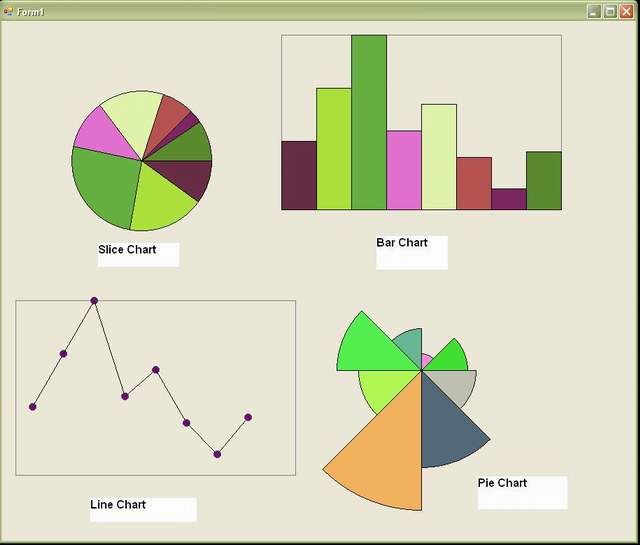
DrawSliceChart DrawPieChart DrawBarChart DrawLineChart
For our example, we will take input weight as (13, 23, 33, 15, 20, 10, 4, 11). We will pass this array to all of the above functions. Let us discuss all the functions one by one.
DrawSliceChart
Consider it as cutting a cake into slices based on the weight. In this chart, angle of slice is linearly proportional to weight. To understand this, we will discuss the FillPie function supported by .NET.
Signature of FillPie is as follows:
Void FillPie(Brush brush, int x,int y, int width,int height,
				int startAngle, int sweepAngle)
This function is used to fill as ellipse if sweep angle is 360. To make it a circle, we make height and width both equal to diameter of circle.
height = width = 2*radius;
Let us look into the details of parameters.
Then I use another function to draw the border around the shape: DrawPie. The only difference between this and FillPie is that it takes Pen object instead of Brush.
private void DrawSliceChart(PaintEventArgs e, int[] alWeight)
{
int numberOfSections = alWeight.Length
int x0 = 100;
int y0 = 100;
int radius = 100;
int startAngle = 0;
int sweepAngle = 0;
int[] height = new int[numberOfSections];
int total = SumOfArray(alWeight);
Random rnd = new Random();
SolidBrush brush = new SolidBrush(Color.Aquamarine);
Pen pen = new Pen(Color.Black);
for (int i = 0; i < numberOfSections; i++)
{
brush.Color = Color.FromArgb(rnd.Next(200, 255),
rnd.Next(255), rnd.Next(255), rnd.Next(255));
if (i == numberOfSections - 1)
sweepAngle = 360 - startAngle;
else
sweepAngle = (360 * alWeight[i]) / total;
e.Graphics.FillPie(brush, x0 - height[i], y0 - height[i],
2*radius, 2*radius, startAngle , sweepAngle);
e.Graphics.DrawPie(pen, x0 - height[i], y0 - height[i],
2*radius, 2*radius, startAngle, sweepAngle);
startAngle += sweepAngle;
brush.Color = Color.FromKnownColor(KnownColor.Black);
}
}
DrawPieChart
This is another chart which also uses the same in built function with little modification in the previous code. In this chart, angle of slice remains the same for all slices but the radius varies based on the weight.
So here we will first find out maximum weight MaxWeight. Then MaxWeight will be equal to the radius and other slices will have radius proportionally lesser then MaxWeight.
e.g. for weight 23:
MaxWeight = 33;
	width = (23*radius)/MaxWeight;
	sweepAngle = 360/TotalNumberOfWeights;
startAngle will start from 0 and is incremented by sweepAngle.
startAngle += sweepAngle;
private void DrawPieChart(PaintEventArgs e, int[] alWeight)
{
int numberOfSections = alWeight.Length;
int x0 = 600;
int y0 = 500;
int radius = 200;
int startAngle = 0;
int sweepAngle = 360/numberOfSections;
int[] height = new int[numberOfSections];
int maxWeight = MaxValue(alWeight);
Random rnd = new Random(10);
SolidBrush brush = new SolidBrush(Color.Aquamarine);
Pen pen = new Pen(Color.Black);
for(int i =0;i<numberofsections;i++){
height[i] = ((Convert.ToInt32(alWeight[i])) * radius) / maxWeight;
brush.Color = Color.FromArgb(rnd.Next(200, 255), rnd.Next(255),
rnd.Next(255), rnd.Next(255));
e.Graphics.FillPie
(brush, x0 - height[i], y0 - height[i], 2 * height[i],
2 * height[i],(startAngle+i*45), sweepAngle);
e.Graphics.DrawPie(pen, x0 - height[i], y0 - height[i], 2 * height[i],
2 * height[i], (startAngle + i * 45), sweepAngle);
}
}
DrawBarChart
In this, we make use of ‘DrawRectangle’ in built function. The idea here is to first create a big rectangle defining the boundary of bar graphs. DrawRectangle takes the following parameters:
Pen – This defines the color and style of border Rectangle – Rectangle object to be created
We will look into the rectangle object.
Rectangle(int x, int y, int width,int height)
X and y are the co-ordinates of top left corner of rectangle.
Width and height are width and height of rectangle.
So to draw a bar, we will use the same function. The only thing we have to identify is these four parameters of Rectangle. Width is constant and is equal to total length of outer rectangle divided by total number of bars. Height is calculated as follows:
Height = (weight of current array element *
		height of outer rectangle )/ maximum weight.
X coordinate is incremented by width of bars everytime a new bar is created.
Y co-ordinate is calculated by the following formula:
y = y coordinate of outer rectangle + height of outer rectangle –
			height of bar calculated using above formula
Like DrawPie and DrawSlice, we fill the shape with the corresponding fill function.
private void DrawBarChart(PaintEventArgs e, int[] alWeight)
        {
            int numberOfSections = alWeight.Length;
            int lengthArea = 400;
            int heightArea = 250;
            int topX = 400;
            int topY = 20;
            int maxWeight = MaxValue(alWeight);
            int[] height = new int[numberOfSections];
            int total = SumOfArray(alWeight);
            Random rnd = new Random();
            SolidBrush brush = new SolidBrush(Color.Aquamarine);
            Pen pen = new Pen(Color.Gray);
            Rectangle rec = new Rectangle(topX,topY,lengthArea,heightArea);
            e.Graphics.DrawRectangle(pen,rec);
            pen.Color = Color.Black;
            int smallX = topX;
            int smallY = 0;
            int smallLength = (lengthArea/alWeight.Length);
            int smallHeight = 0;
            for (int i = 0; i < numberOfSections; i++)
            {
                 brush.Color = Color.FromArgb(rnd.Next(200, 255),
			rnd.Next(255), rnd.Next(255), rnd.Next(255));
                 smallHeight = ((alWeight[i] * heightArea )/ maxWeight);
                 smallY = topY + heightArea - smallHeight;
                 Rectangle rectangle = new Rectangle
			(smallX, smallY, smallLength, smallHeight);
                 e.Graphics.DrawRectangle(pen,rectangle);
                 e.Graphics.FillRectangle(brush, rectangle);
                 brush.Color = Color.FromKnownColor(KnownColor.Black);
                 e.Graphics.DrawRectangle(pen, rectangle);
                 smallX = smallX + smallLength;
             }
        }
DrawLineChart
To draw a line chart, we first create boundary with ‘DrawRectangle’ in built function. Then we decide on the points to draw the line.
X coordinate is incremented by equal distance and y co-ordinate is set based on the weight.
Here, to highlight each point, I am using function DrawDots to highlight the point by making a circle of radius 5.
private void DrawLineChart(PaintEventArgs e,int[] alWeight)
{
    int numberOfSections = alWeight.Length;
    int lengthArea = 400;
    int heightArea = 250;
    int topX = 20;
    int topY = 400;
    int maxWeight = MaxValue(alWeight);
    int[] height = new int[numberOfSections];
    int total = SumOfArray(alWeight);
    Random rnd = new Random();
    SolidBrush brush = new SolidBrush(Color.Aquamarine);
    Pen pen = new Pen(Color.Gray);
    Rectangle rec = new Rectangle(topX, topY, lengthArea, heightArea);
    e.Graphics.DrawRectangle(pen, rec);
    pen.Color = Color.Black;
    int smallX = topX;
    int smallY = 0;
    int smallLength = (lengthArea / (alWeight.Length + 1));
    int smallHeight = 0;
    Point p1 = new Point();
    Point p2 = new Point();
    for (int i = 0; i < numberOfSections; i++)
    {
        brush.Color = Color.FromArgb(rnd.Next(200, 255),
		rnd.Next(255), rnd.Next(255), rnd.Next(255));
        p1 = p2;
        p2.X = p2.X + smallLength;
        smallHeight = ((alWeight[i] * heightArea) / maxWeight);
        p2.Y = topY + heightArea - smallHeight;
        if (p1.X != 0 && p1.Y != 0)
        {
            e.Graphics.DrawLine(pen, p1, p2);
        }
        DrawDots(e,p2);
        smallX = smallX + smallLength;
    }
}
Here is the function to highlight the point:
private void DrawDots(PaintEventArgs e, Point p1)
{
    Pen pen = new Pen(Color.SeaGreen);
    e.Graphics.DrawPie(pen, p1.X-5 , p1.Y-5, 10, 10, 0, 360);
    e.Graphics.FillPie(new SolidBrush(Color.Purple),
			p1.X - 5, p1.Y - 5, 10, 10, 0, 360);
}
Points of Interest
So these are few of the charts that we can create. We can also customize them based on our requirement. If your requirement is simply to draw one chart similar to any of these three, just copy paste the function and change the co-ordinate and color as per your requirement. In addition to that, I have used 2 more simple functions to get maximum and total of array. You can find the complete source code attached.
The important thing to note is that all the four functions are called from Paint event handler function and takes PaintEventArgs and array of weights as parameters.
History
- 7th April, 2009: Initial post
I have been into software development for almost 10 years.
I like programming especially in C# and Javascript but not limited to just 2 languages.
My passion is to design highly scale-able software. I prefer design patterns, domain driven design, TDD.


 General
  News
News  Suggestion
  Question
  Bug
Bug  Answer
  Joke
Joke  Praise
  Rant
Rant  Admin
Admin 


