This is part 2 of the series Analysing Data in Real Time #1, #2
Introduction
In the last article we took a look at how Complex Event Processing (CEP) systems were being used in the real world and in particular Microsoft's StreamInsight within sports broadcasting. The potential applications for this technology can be quite broad from filtering and acting on application logging all the way up to algorithmic trading. In this article I will endeavor to illustrate how you can use this technology yourself with the help of a simple demo application.
The latest versions of StreamInsight are heavily integrated with Linq and just like LinqToSql or LinqToObjects it has it's own provider that allows us to express temporal (ie. over time) queries for the CepStream type.

Bridge methods allow us to convert between interfaces
Combined with LinqRx, the important interfaces for us to understand are:
IQStreamable - Defines a remote temporal stream of events
IQueryable - Support for deploying query functions to the engine
IObservable - Allows Observers to be notified of changes to the underlying stream
If you're only interested in the examples of how to use these, then please skip to the Processor section below.
Background
To support this and future articles, I've created 2 pieces of supporting infrastructure to help us use and understand StreamInsight.
To analyse data in real time, we'll actually need a source of real time data! I'd hoped that it would be relatively easy to find something like a delayed stock market data feed that people could sign up to. Unfortunately anything that is free only updates at a low frequency i.e once a minute, but we would like something faster. So instead I wrote a SignalGenerator using the principle of superposition to generate a sinusoidal wave of data with random overtones.
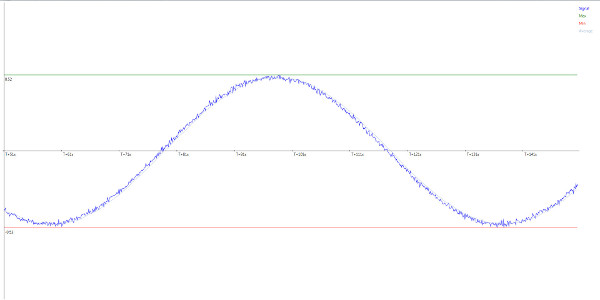
Secondly we might like is something to visualise the signal and compare this and any analysis we do on it. In WPF I created an animated graph control that auto-scales and resizes (screen shots below), which will display timeseries data to a limit before dequeueing those beyond it. Hence why you'll observe a moving wave as the data continues to be generated.
Using the code
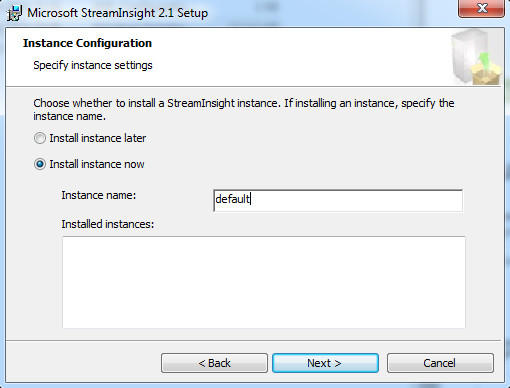
Download and install StreamInsight 2.1 from this link
Use all the defaults except for the screen below. Either name the installed instance as 'default' or be prepared to change the attached code on first run:
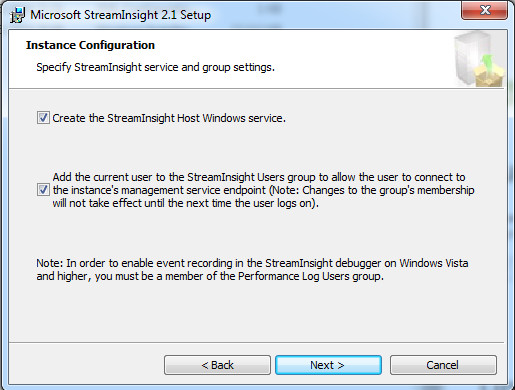
Add the current user to the StreamInsight group as we will use this in a later article:
Download the attached zip file and unzip the code, before loading into Visual Studio 2012 Express for Desktop or greater.
Once, built and run select the 'Go' button and as long as everything worked correctly you should see data being generated.
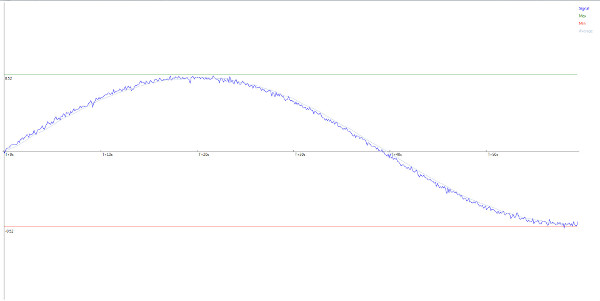
As time proceeds you should see a travelling Sine wave...
StreamInsight depends on Reactive Extensions (LinqRX) version 1.0.10621 which I've referenced and provided statically. If for any reason these references are missing then you can either download them from codeplex or mail me and I'll fix it.
Likewise, StreamInsight API is referenced statically however you still need to install a StreamInisght instance for the code to work!
The Pipeline Pattern (aka Pipes and Filters)
Pretty much anything you will ever do with regards to moving data and streams can be expressed as some kind of moving extract-transform-load process where each event or message is sourced, processed and passed on to somewhere else. This is often referred to as pipping and filtering or simply a pipeline.

MSDN's definition of a pipeline is appropriate here as a 'Task' could be any one of a reduction, projection or enrichment.
For the purposes of this article I will refer to these 3 steps as Source, Processor and Sink
1. Source: Signal Generator
Generating a repeating wave is relatively simple, but to make something that varies a little bit randomly we have to generate some random numbers. Rather than use the default flat distribution of the Random class, I've used a normally distributed random number generated from a class I discuss in more detail in the code tip Emulate-Human-Mouse-Input-with-Bezier-Curves-and-Gaussian-Distributions
public class SignalGenerator
{
NormalDistribution normalDistribution = new NormalDistribution();
public SignalGenerator(double r, double a, int harmonics)
{
this.r = r;
this.a = a;
this.harmonics = harmonics;
waveLength = 2 * Math.PI * r;
tickIncrementRatio = 1.0/360;
}
private long tickCount;
private double r;
private double a;
private double tickIncrementRatio;
private double waveLength;
private int harmonics;
public double Next()
{
double angle = tickCount * tickIncrementRatio * waveLength;
double drift = a * Math.Sin(angle);
double shock = normalDistribution.NextGaussian() ;
double result = (drift != 0) ?
drift + (shock * 0.01)
: drift;
tickCount++;
return result;
}
}
The PointAdapter that owns both the RepeatingTask and the SignalGenerator is the interface to the StreamInsight engine. As such it is created by and it's lifetime is controlled by StreamInsight meaning that the RepeatingTask (that calls the SignalGenerator) will be created via the GeneratorFactory when we initialise our application.
These are important points to remember when using this technique to push data into the system, as this signal generation is within StreamInsight itself rather than from the outside. The code below is a boiler plate method from MSDN that checks the current state of StreamInsight before deciding whether to insert new data into a source stream:
public void ProduceEvent(GeneratedEvent data)
{
if (AdapterState.Stopping == AdapterState)
{
Stopped();
return;
}
if (AdapterState.Running != AdapterState)
{
return;
}
PointEvent<GeneratedEvent> currEvent = CreateInsertEvent();
if (null == currEvent)
{
return;
}
currEvent.StartTime = DateTime.Now;
currEvent.Payload = data;
if (EnqueueOperationResult.Full == Enqueue(ref currEvent))
{
ReleaseEvent(ref currEvent);
Ready();
return;
}
}
As you can see, a new event will only be pushed into the engine if the StreamInsight application is running and not shutting down.
2.The Processor: Filters, Partitions & Projections
The responsibiliy of the Processor is to initialise and configure the inputs, queries and outputs of an embedded instance of the StreamInsight engine.
defaultServer = Server.Create("default");

demoApp = defaultServer.CreateApplication("demo");
One thing that is not immediately obvious from the documentation or other code examples is that despite it being 'embedded', all you are really doing is creating remoting objects and sending serialized data back and forth to the running service.
For example in the code below we define a source stream of GeneratedEvents using a factory for which we send a new instance of a configuration object. Remember, this object is copied by value due to serialization do not attempt to pass something that requires a reference such as CancellationToken!
var mySource = demoApp.DefineStreamable<GeneratedEvent>(
                typeof(GeneratorFactory), new GeneratorConfig()
                { CtiFrequency =1 },
                EventShape.Point, null);
If our source contains signals from multiple devices, the simplest Linq query we can apply to the stream is a simple filter. For example:
var mySignal = mySource.Where(x => x.DeviceId=="Signal1");
We can visualise this filtration like so: 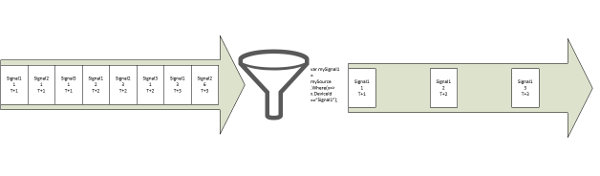
With our signal discriminated from the underlying data stream, we can now define further queries to monitor the stream and act upon patterns they detect. So lets partition the signal with a tumbling window
var myTumblingWindow =mySignal.TumblingWindow(new TimeSpan(0, 0, 1));
If we were to have a signal that produced an event once per second and wanted to define a tumbling 2 second window (ie. a window over the data 2 seconds in length and which repeats every 2 seconds), we could visualise it this way:
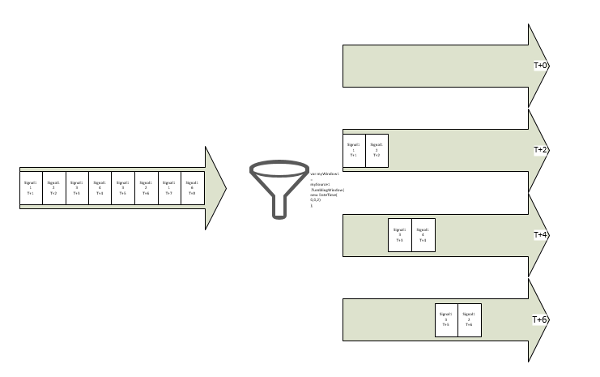
Note that a window does not exist until completion of the time period. Hence at T=0 and T=1 we have no data, it's only at T=2,4,6 etc that a result is pushed to the next stage in the pipeline.
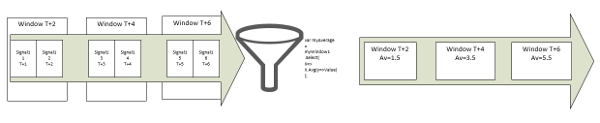
var average =myTumblingWindow
    .Select(x => x.Avg(y => y.Value));
var averageObservable = average.ToObservable();
In the demonstration code we create a 1 second tumbling window and then average each of these and project the results to a new stream.
We make the average stream Observable using the bridge method and hook an Observer function that is called whenever a new item is inserted into the underlying collection:
average.Subscribe(new Action<double>(updateSource));
Likewise we do the same with the source stream so that both can be piped to the UI which we will talk about next.
Finally, lets generate the Max and Min values within our tumbling window so the graph control can infer some historical limits
var max = tumblingWindow.Select(x => x.Max(y => y.Value)).ToObservable();
var min = tumblingWindow.Select(x => x.Min(y => y.Value)).ToObservable();
3. Sink: Graph Control
The graph control is essentially just a canvas that is updated periodically by the dispatcher timer. It contains a ConcurrentQueue (which is perhaps overkill) that a user of the class can access to pump in new data points that are then painted to the screen.
It's not key to understand exactly how the function below achieves this, however if you don't want to download the source code then here it is:
private void RenderDataSeries()
{
if (null != DataSeries && DataSeries.Count > 0)
{
long start, end;
Coordinate[] dataSeriesCopy;
lock (DataSeries)
{
start = DataSeries.Min(x => x.X).Ticks;
end = DataSeries.Max(x => x.X).Ticks;
while (TimeSpan.FromTicks(end - start)
.TotalMilliseconds > 100000
&& DataSeries.Count > 0)
{
Coordinate discarded;
DataSeries.TryDequeue(out discarded);
start = DataSeries.Min(x => x.X).Ticks;
}
dataSeriesCopy = DataSeries.ToArray();
}
You can see that I try to block access to the inbound queue for a minimal amount of time, dequeuing data that we don't want to paint to the UI.
I use the event meta-data to print out a legend...
int seriescount = 0;
legend.Children.Clear();
RenderLegend(dataSeriesCopy.GroupBy(x => x.SeriesName)
.Select(y => y.Key).ToArray());
Calculate a scaling factor for each of the co-ordinates based on the current dimensions of the canvas.
foreach (var seriesGroup in dataSeriesCopy.GroupBy(x => x.SeriesName))
{
Polyline p = new Polyline();
p.Stroke = paintables[seriesGroup.Key];
p.StrokeThickness = 1;
if (seriesGroup.Count() <= 1) continue;
long last = 0;
if (seriesGroup.Key == "Min" | seriesGroup.Key == "Max")
AddLimit(seriesGroup.ToArray(), seriesGroup.Key);
else
{
double first = 0.0;
foreach (Coordinate coord in seriesGroup)
{
double xScale = Convert.ToDouble(coord.X.Ticks - start)
/ Convert.ToDouble(end - start);
double yScale = coord.Y * (canvas.ActualHeight / 2);
double x = X0 + (xScale * canvas.ActualWidth);
double y = (canvas.ActualHeight / 2) - yScale;
p.Points.Add(new Point(x, y));
Finally, I animate the scale of X-Axis for a 10 second ordinals:
        double gapInMillisecs = TimeSpan
        .FromTicks(coord.X.Ticks - last).TotalMilliseconds;

        if (seriesGroup.Key == "Signal"
            && gapInMillisecs >= 10000)
        {
            if (initial == 0.0)
            {
                AddXAxisScale(initial, coord, xScale);
                initial = gapInMillisecs;
            }
            if (first == 0.0)
            {
                first = TimeSpan.FromTicks(coord.X.Ticks)
                        .TotalMilliseconds - initial;
                AddXAxisScale(first, coord, xScale);
            }
            else
            {
                double current = TimeSpan.FromTicks(coord.X.Ticks)
                                 .TotalMilliseconds - initial;
                AddXAxisScale(current, coord, xScale);
            }
            last = coord.X.Ticks;
        }
    }
}
All in all the xyGraph control was a little bit more work than I expected, but as I couldn't easily find anything free that would animate and scale easily the it works quite well. Feel free to reuse and modify it if you wish.
Obviously our sink here is a visual one, but hopefully you can see that it is relatively simple to provide your own observers and actions that can do anything from logging to a data base, executing buy orders or even advising a driver where he is slow!
Conclusions
With the infrastructure in place to create, process and visualise signals and their derivatives we are in a good place to begin delving into the more complicate feautres of StreamInsight.
As I hope you can see, defining simple queries is relatively trivial with LinqRx. Infact we've not really done much than could not be achieved with the techniques shown in one of my presvious articles. However as we will see later things can become quite complex rather quickly so we will need to make use of the full StreamInsight toolset to help us.

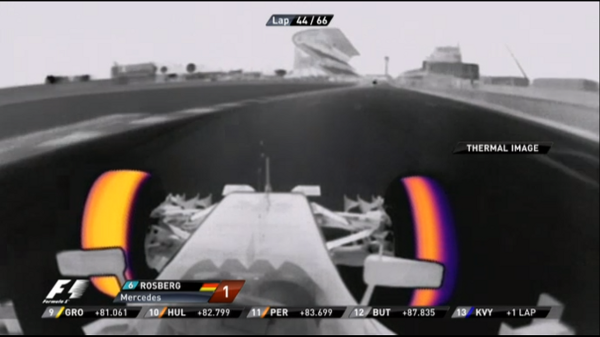
Use StreamInsight and you'll end up like these guys. Honest!
Next up we'll start looking at joining streams and other more complex operations as well as debugging, the management interfaces, replaying test cases, high availability and much more...
History
1.1 Creation
1.2 Link paths
1.3 Added historical limits
1.4 Added more detail about Linq and Rx intefaces
1.5 Refactored and added more functionality to the graph control as well as more detailed explanation
Added far more detail about usage patterns, pictures diagrams
1.6 Added more diagrams to explain Filters, Partitions and Projections


 General
  News
News  Suggestion
  Question
  Bug
Bug  Answer
  Joke
Joke  Praise
  Rant
Rant  Admin
Admin 


