Introduction
Free for PERSONAL and COMMERCIAL use
This article introduces the SolidWidgets Report Designer, which is part of the SolidWidgets UI framework library.
The Report Designer comes as a separate executable, which is used to create reports from scratch.
The designer allows developers to create custom reports, or pre-defined barcode and address label reports. In the custom report mode, you can
drag and drop individual report components, and then size them and move them anywhere within the report page. Every report can have a header,
a footer, and a detail section. The designer works similar to other popular report designers, but requires a lot less learning curve. The product
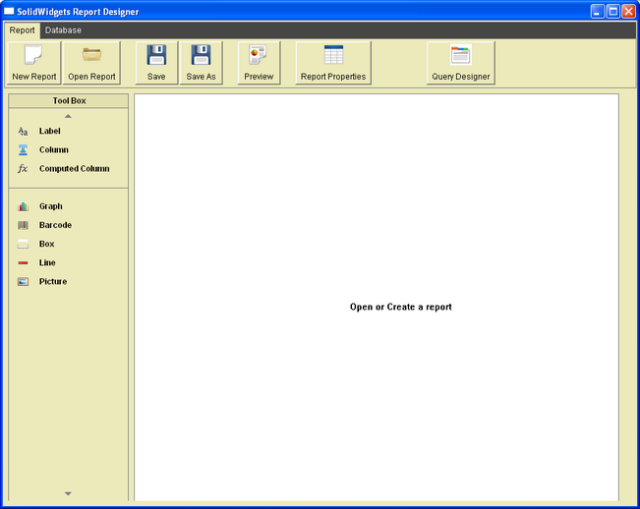
is designed for ease of use, and contains a control that can be embedded within application to view and print the reports created with this designer.
Here is what the report designer looks like:
Creating a custom report
To create a custom report using the SolidWidgets Report Generator/Designer, click on the New Report button on the toolbar.

- Click the Browse button under the report path to choose the folder where you want to save the new report, enter the name of the new report and click Save.
- If you have a database that you want the report to fetch data from, enter the connection string needed to connect to that database in the Connection String field.
- Choose the Custom Report template from the Report Type dropdown list.
- Leave the Report Format blank since it is only applicable to barcode and address label reports.
- If you want to hookup this report to a particular query, click on the Design Query button to create the query, after that, you can select the query from the dropdown list after it has been saved. if you want to skip this step for now, you can always open the report and click on Properties to return to this screen and set the query or change it.
- Click OK to save the new report. Once the report is saved by the designer, it will be automatically opened inside the report designer so you can immediately begin designing your report.
As you can see, the report has three bands (header, detail, and footer). You can increase the height of each band by clicking on the band bar (Black Bar), and dragging it up or down.
To add an item to the report, click on the item under the ToolBox, and then click inside the section where you want the item to be added.
If you want the item to be added to the report header, click inside the header section above the header bar. The new item will be added at the point
where you clicked the mouse. As soon as you click inside the section where you want to drop the new item, the designer immediately displays the item
property dialog to allow you to change the properties of the newly added item. In this dialog, you can also change the type of the item to another
type by selecting the new type from the Object Type dropdown list. Every time you change the object type, the dialog refreshes itself
to show only those properties that are applicable to the selected object type.
If this item is a label, enter the text that you want to appear inside the label, you can also set the font, alignment, colors, and whether the label should
be displayed with a border around it. Click OK, and you will then see the effects of the changes you made to the item inside the properties dialog.
Go ahead and practice by adding few more objects to the report, here is what my report looks like after adding few database columns, a graph, and some header and footer objects.
If I click on the Report Properties button on the toolbar, here is how I entered my database connection information for this report, and the query I assigned it to be used to fetch
the data for the detail section of the report.
If the database connection and query are valid, click on the Preview button on the toolbar to see what the report will look like when it is executed.
Query Designer
Although the report designer allows you to add queries manually by typing in the full SQL statement into the query editor, it also includes a nice and easy
to use query designer. To add a query manually, click on the Database tab above the toolbar, click on Add Query, enter the query statement inside the
query statement field, assign it a name and click OK. All queries are saved in a file called
Queries.qry under Program Files\SolidWidgets\Reporter.
The queries that you add can be used with any report, and they are not attached to a specific report; think of them as a pool of queries that you can used at any time with any report.
In addition to being able to manually type in a query statement, the report designer also includes a query designer that can be used to design the query visually.
You can access the query designer from the Query Editor dialog, from the report designer toolbar, and from the report properties dialog.
Here is a snapshot of what the designer screen looks like:
After entering the connection string to the database, click on the New Query button to choose the tables from the database. You can choose
up to four tables in this editor. Once the tables have been selected, you can select the columns from each table that you want to be part of the query select columns. To join tables, click
on the arrow that appears to the right or left side of the column, and drag the mouse to the arrow next to the column to join with in the joining table. Once you are done,
click OK to save the new query.
Conclusion
This is my second tutorial on the SolidWidgets library. I'm hoping to continue to add more articles as I learn more about the library,
and as time permits. I just want to express how pleased I have been with the library, I'm currently using it for all my consulting projects.
This member has not yet provided a Biography. Assume it's interesting and varied, and probably something to do with programming.


 General
  News
News  Suggestion
  Question
  Bug
Bug  Answer
  Joke
Joke  Praise
  Rant
Rant  Admin
Admin 


