Why profile memory usage?
A common misconception when developing in a managed environment like .NET is that the environment will entirely manage the efficient usage of resources like memory. Although the developer’s task of handling memory may be greatly simplified in a managed environment, significant attention is still needed to ensure resources are freed up once they are not needed. The .NET Garbage Collector, for example, automatically frees up memory which is no longer being referenced by another object – but it remains the role of the developer to ensure that references to objects are destroyed when those objects are no longer needed. If references are not correctly removed, the memory will never be freed, and the application will experience a memory leak.
The Simple Solution
ANTS Memory Profiler makes tracking down problems like these simple - you can start analyzing your application’s memory usage within minutes, without reading a manual. After running ANTS Memory Profiler, we simply select the application we want to examine, then click ‘start profiling’, and the application is loaded for us.
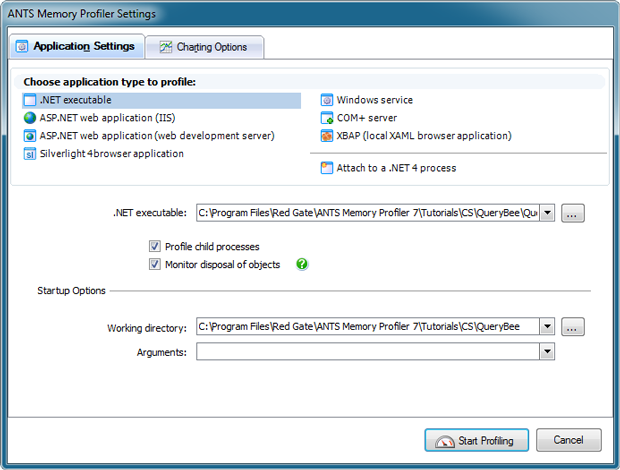
Figure 1. Selecting an application
We can profile .NET executables, ASP.NET and Silverlight 4 applications, Windows services, COM+ server, and XBAP apps. ANTS Memory Profiler can also attach to a running .NET4 process, resulting in zero downtime and enabling profiling of hard-to-reproduce application states.
We profile memory usage by taking snapshots, then analyzing their contents. ANTS Memory Profiler has an API to allow automated snapshots to be taken from inside your code, or we can simply push the ‘take snapshot’ button. Snapshots appear on the interactive timeline alongside continually updated performance metrics, allowing quick visualization of how the snapshots relate to events in the application.

Figure 2. The interactive timeline
We can choose which snapshot to analyze, and can also compare snapshots side-by-side to understand how memory usage changed between snapshots.
Figure 3. Switching between different memory snapshots
So how efficiently is memory being used?
After selecting a snapshot, ANTS Memory Profiler instantly generates a Summary Screen displaying the most important information. We get statistics on Large Object Heap Fragmentation, and a comparison of total memory usage between snapshots. We also get a graph showing the proportions of memory stored in the different .NET heaps, which is particularly useful for assessing whether instances are being held onto for longer than necessary. Finally we are shown a pie chart of the largest classes. Although there may be legitimate reasons for a class to occupy a large amount of memory, the largest classes are often a good place to start when looking for memory problems.
Figure 4. The summary screen
ANTS Memory Profiler’s Class list shows all the classes which were in memory for a given snapshot. A range of new filtering options allow us to quickly cut through the noise to find suspect classes for further analysis, and we can also find the most expensive classes by sorting by the total size or number of instances.
Figure 5. The class list
Closing in on the Problem
Having found a suspicious class, we can use the new Instance Categorizer to examine why the instances of that class are being held in memory. The Instance Categorizer automatically groups together instances which share the same shortest path back to GC Root. We can then quickly browse through these chains to understand what is holding certain groups of instances in memory.
Figure 6. The instance categorizer
It is not uncommon to find tens or hundreds of thousands of instances held in memory by the same chain back to GC root. The instance categorizer eliminates the otherwise near-impossible task of examining each instance in turn to decide whether it is causing a problem.
Having categorized each of the instances by the reason for which they are being held in memory, ANTS Memory Profiler can show us a list of each of those instances. We can then generate an Instance Retention Graph for any of these instances in order to determine the precise reason for it being held in memory.
Figure 7. The instance retention graph
We can browse up the chain of references to be shown every way in which this instance is referenced, knowing that breaking any one of the links in that chain would have allowed that chunk of memory to be freed. Strongly interconnected objects are grouped together to make it even easier to select the most appropriate place to break the chain of references.
What’s next?
ANTS Memory Profiler is the simplest, most effective way to resolve memory problems in .NET code. To discover how quickly it could help you improve your own application, download your free 14 day trial today.
Redgate makes ingeniously simple software used by 804,745 IT professionals and counting, and is the leading Microsoft SQL Server tools vendor. Our philosophy is to design highly usable, reliable tools which elegantly solve the problems developers and DBAs face every day, and help them adopt database DevOps. As a result, more than 100,000 companies use products in the Redgate SQL Toolbelt, including 91% of those in the Fortune 100.


