By: Sajid Majeed
Introduction
It has been observed that many batch processes developed without keeping performance parameters in mind. The reasons for this can be “It is nightly schedule jobs, no matter how much CPU/Memory it uses” or “it is a background job; No interaction with User. What’s wrong if it takes an extra hour?”
But what will happen if an enterprise uses multiple nightly jobs? Or what will happen if results of that batch job are required in later part of the day for some other department.
If we take example of banking sector; where data collection, data processing & rule validation services have become key part of their business and they interact with many third party services and Data Servers to synchronize and validate their data etc. In this case, a single BAD service from any new vendor can create problem for an enterprise.
This article is actually based on a case study where a performance needed to improve in a functionally stable and tested .Net windows service which was intended to deploy on Enterprise server of a corporate bank in USA.
This article will address tools and technologies to identify bottlenecks and key consideration points for performance improvement.
How to identify the problem areas?
As rule of common sense, you can’t cure unless you don’t know what and where to cure.
Time Logging
This is best strategy proven, write timestamp, before and after of every function, in a text file. Once process is complete; you can analyze the text file. But analyzing text file, if it grows in MBs, is a tedious and time taking activity. What you need to do is “Log timestamp text intelligently”. This can be done by adding some separators so that you can easily board in this file into excel or database table.
Putting it in database table can help you more because one can easily query and can get trends and problem areas. Here you can see how much time each function is taking. Once you get the high level timings of function(s) you can easily identify the function(s) which are taking more time than they should take. Now drill down this logging activity on each statement of that function(s) and analyze. One can easily get the Culprit statement(s).
This is tedious activity; but as it is proven with time that this strategy will tell you what is actually happening in code while executing.
.NET: HiResTimer class
This simple little C# class wraps Kernel32's QueryPerformanceCounter API and returns the time taken by code statements. This Elapsed time can also be used as time logging instead of logging current time.
The code below is taken from http://www.windojitsu.com/code/hirestimer.cs.html. This link has source code for this class and its usage.
Usage is straightforward:
HiResTimer hrt = new HiResTimer();
hrt.Start();
DoSomethingLengthy();
hrt.Stop();
Console.WriteLine("{0}", hrt.ElapsedMicroseconds);
|
Profiling
This is automated approach to identify the suspected areas on fly in minutes. There are multiple tools available in market to profile databases and .net assemblies.
Database Profiling
Enterprise editions of SQL Server 2000 and 2005 have Profiling tools built in. There are few built in templates; but many times they you need to have your own template to identify the query/operation timings etc.
Please remember that while using profiling, logging activity may not show proper results.
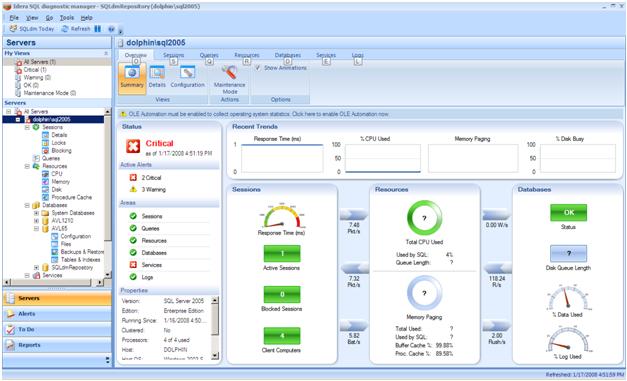
Along with these built in profilers, there are some other very useful DB profiling tools available in Market. Idera tools (SQL diagnostic manager), is very good example of DB profiling. Which gives you query execution time, CPU and memory usage, Blocking commands, Locks, Tables and indexes health etc. and furthermore it highlights the commands which takes time more than a specified time. Below are few screenshots of this tool.
Using this tool, you can get the list of Bad queries. These queries need to be searched in source code and procedures and DBA and DB Developer can optimize it using different optimization strategies. There can be full table scan, wrong indexes, Dead locks, Waits etc. If DBA or DB Architect is not aware your applications business, then he or she should have clear agenda and boundaries in his/her mind. Few points are mentioned in Fix Performance Issues section<shapetype id="_x0000_t75" coordsize="21600,21600" o:spt="75" o:preferrelative="t" path="m@4@5l@4@11@9@11@9@5xe" filled="f" stroked="f"> <stroke joinstyle="miter"><formulas /><f eqn="if lineDrawn pixelLineWidth 0"><f eqn="sum @0 1 0"><f eqn="sum 0 0 @1"><f eqn="prod @2 1 2"><f eqn="prod @3 21600 pixelWidth"><f eqn="prod @3 21600 pixelHeight"><f eqn="sum @0 0 1"><f eqn="prod @6 1 2"><f eqn="prod @7 21600 pixelWidth"><f eqn="sum @8 21600 0"><f eqn="prod @7 21600 pixelHeight"><f eqn="sum @10 21600 0"></formulas /><path o:extrusionok="f" gradientshapeok="t" o:connecttype="rect"><lock v:ext="edit" aspectratio="t"><shape id="Picture_x0020_10" style="VISIBILITY: visible; WIDTH: 468.75pt; HEIGHT: 283.5pt" o:spid="_x0000_i1030" type="#_x0000_t75"><imagedata src="file:///C:\DOCUME~1\SAJID~1.MAJ\LOCALS~1\Temp\msohtmlclip1\01\clip_image001.png">
<shape id="Picture_x0020_13" style="VISIBILITY: visible; WIDTH: 468.75pt; HEIGHT: 283.5pt" o:spid="_x0000_i1029" type="#_x0000_t75"><imagedata src="file:///C:\DOCUME~1\SAJID~1.MAJ\LOCALS~1\Temp\msohtmlclip1\01\clip_image002.png"><shape id="_x0000_i1028" style="VISIBILITY: visible; WIDTH: 469.5pt; HEIGHT: 296.25pt" type="#_x0000_t75"><imagedata src="file:///C:\DOCUME~1\SAJID~1.MAJ\LOCALS~1\Temp\msohtmlclip1\01\clip_image003.png">Idera is more useful for background data import process because mostly data import services uses multiple servers and you need to identify bottlenecks on both servers.

Application Profiling
Finding performance bottlenecks in application (.NET Code) is very important. There are many tools like dotTrace by Jet Brains and ANTS profiler by Red Gate. These tools helped us to identify the root cause of our problem. These are actually automated alternates of manually timestamp logging strategies,
In our case study, we used and evaluated ANTS profiler 3
As a result of profiling; this tool provides you list of all methods, which have been called for a process, with time consumed, time consumed with children and most important hit count. This profiling tool has source code information with it and helps you to drill down in hierarchy and display time consumed with each line of code. You can easily identify the code areas where execution time is more than expected. Below are screen shots of this tool.
<shape id="Picture_x0020_1" style="VISIBILITY: visible; WIDTH: 468.75pt; HEIGHT: 283.5pt" o:spid="_x0000_i1027" type="#_x0000_t75"><imagedata src="file:///C:\DOCUME~1\SAJID~1.MAJ\LOCALS~1\Temp\msohtmlclip1\01\clip_image004.png">
<shape id="Picture_x0020_4" style="VISIBILITY: visible; WIDTH: 468.75pt; HEIGHT: 283.5pt" o:spid="_x0000_i1026" type="#_x0000_t75"><imagedata src="file:///C:\DOCUME~1\SAJID~1.MAJ\LOCALS~1\Temp\msohtmlclip1\01\clip_image005.png">
Performance monitors using performance counters
This diagnostic tool can be accessed from Control Panel -> Administrative Tools -> Performance. You need to add performance counter intelligently. The most important are SQL Server, .NET and ASP.NET performance counters. This can help you to identify the table scans, index scans, lock requests, number of dead locks, Time consumed by GC and many more.
Important performance counters are listed below
Performance Counter
| Comments
|
SQLServer:Access Methods - Full Scans / sec
| Value greater than 1 or 2 indicates that we are having table / Index page scans. We need to analyze how this can be avoided.
|
SQLServer:Access Methods - Page Splits/sec
| Interesting counter that can lead us to our table / index design. This value needs to be low as possible.
|
SQLServer:Access Methods - Table Lock Escalations/sec
| This gives us the number of times a table lock was asked for in a second. A high number needs a revisit to the query and the indexes on the table.
|
SQL Server:Buffer Manager - Buffer cache hit ratio
| The percentage of pages that were found in the memory. Higher the value the better. Preferred around the 90% mark. This included the availability of the procedure and the data cache in the system.
|
SQL Server:Buffer Manager - Database pages
| This number shows the number of pages that constitute the SQL data cache. A large changes in this value indicates the database is swapping cache values from the cache. We need to either increase the memory of the system or the max server memory parameter.
|
SQL Server:Buffer Manager - Procedure cache pages
| This indicates the number of procedures are present in the cache. This is the location where the compiled queries are stored.
|
SQL Server:Buffer Manager - Stolen pages
| This is the number of pages that were stolen from the buffer cache to satisfy other memory requests.
|
SQL Server:Cache Manager - Cache hit ratio
| The ratio between the cache hits and misses. This counter is a good indicator of our caching mechanism in SQL Server. This value needs to be high in the system.
|
SQL Server:Databases - Active Transactions
| The number of currently active transactions in the system.
|
SQL Server:Databases - Log growths
| The number of times the log files have been extended. If there is lot of activity in this counter we need to allocate static and large enough space for our log files.
|
SQL Server:Databases - Transactions/sec
| This number indicates how active our SQL Server system is. A higher value indicates more activity is occurring.
|
SQL Server:General Statistics - User Connections
| The number of users currently connected to the SQL Server.
|
SQL Server:Locks - Lock Requests/sec
| Number of requests for a type of lock per second.
|
SQL Server:Locks - Average Wait Time
| This is the average wait time in milliseconds to acquire a lock. Lower the value the better it is.
|
SQL Server:Locks - Number of Deadlocks/sec
| The number of lock requests that resulted in a deadlock.
|
SQL Server:Memory Manager - Optimizer Memory
| The amount of memory in KB that the server is using for query optimization. We need to have a steady value in this counter. A large variation in the value suggests there is lot of Dynamic SQL is getting executed.
|
SQL Server:Memory Manager - Connection Memory
| Amount of memory in KB used to maintain the connections.
|
SQL Server:SQL Statistics - SQL Compilations/sec
| The number of times per second that SQL Server compilations have occurred. This value needs to be as low as possible.
|
SQL Server:SQL Statistics - SQL Re-Compilations/sec
| This needs to be nil in our system as much as possible. A recompile can cause deadlocks and compile locks that are not compatible with any locking type.
|
Processor - %Processor Time
| The percentage of time the processor spent executing a non-idle thread. This value is subtracted from the time the processor was idle 100 percent. This is an indicator to the overall CPU utilization in the system.
|
Processor - %Interrupt Time
| The percentage of time the processor spent servicing hardware interrupts. This can be any activity on the server machine. This needs to be 0 while our testing process.
|
Processor - Processor Queue Length
| This counter indicates the number of threads that are waiting in the processor queue. It can be also interpreted as the number of threads that are waiting to be run by the processor. If this value is greater than the number of processor then we have a CPU bottleneck in the system.
|
Processor - Context Switches/sec
| This is an interesting counter. A typical context switch occurs when the OS or the application is forced to change the executing thread on one processor to another thread executed on another processor. This value has to be as small as possible. Context switches are not avoidable in multi-processor machines. Hence any value below 10000 is fine.
|
PhysicalDisk - %Disk Read Time
| Time spent by the disk for read operation. We can have disk by disk analysis also to narrow down any read IO bottlenecks.
|
PhysicalDisk - %Disk Write Time
| Time spent by the disk for write operation. We can have disk by disk analysis also to narrow down any write IO bottlenecks.
|
PhysicalDisk - Avg. Disk Queue Length
| Average number of requests that waited for the read and write requests in the particular disk. A high value suggests we have a IO bottleneck.
|
Memory - Page Faults/sec
| Total number of faulted pages handled by the processor per second. This value needs to as small as possible.
|
Memory - Pages/sec
| The number of pages written to disk or from disk to resolve page faults. This would be the sum of page reads/sec and page writes/sec counter
|
ASP.NET Performance Counters are available on MSDN website and are really helpful to understand the importance and usage of counters.
Here is sample screenshot of process monitoring tool.
<shape id="Picture_x0020_7" style="VISIBILITY: visible; WIDTH: 468.75pt; HEIGHT: 284.25pt" o:spid="_x0000_i1025" type="#_x0000_t75"><imagedata src="file:///C:\DOCUME~1\SAJID~1.MAJ\LOCALS~1\Temp\msohtmlclip1\01\clip_image006.png">
Key Consideration points to resolve Performance issues
Usually the performance issues appear once application has developed or in Last phase of development or in production. One can prevent these issues by applying the best practices for performance and optimization; but most important thinking in optimization & scalability.
It’s quite easy to optimize user interactive application as compared to background batch process because in user interactive application, a portion of application executes against any event while in background process the case can be different.
While fixing the performance issues; following are the key points which should be in mind and on agenda.
Fixing should be made by development team who has developed the module or working on that application. Because giving this task to some technology expert group will come in lot of Refactoring suggestions.
The fixing should be made by keeping in mind the signature or contract of module/function/procedure should not be changed. Else the development and testing activities may prolong and risk will become higher.
Applying multithreaded approach, intelligently, can produce better results on multi core machines.
Always execute the problem identification techniques, after applying fixes, to use as litmus test.
The behavior of performance cannot be judged if you execute only few cycle of process. For real stats, you need to execute process in long and multiple cycles so that any increase in memory usage or CPU usage can be identified if it increases with passage of time.
Hardware sizing & environment softwares
Always, it is not possible to resolve performance issues by making some fixes and applying optimization techniques. You also have to look into Hardware and software.
For example, by adding more RAM or more powerful CPU can boost the performance. But the software (Operating System & Database Servers) should be compliance with the hardware. For example; on Server Class machines with 2 or higher CPUs and 5GB or higher RAMs, standard editions of these software may not work appropriately. Similarly developer edition, workgroup edition or standard editions have its own limitations. So by recommending the Hardware and software specifications intelligently can also serve the purpose.
Please remember; performance issues due to poor hardware and software combinations can never be improved programmatically in limited time.
“Sometimes bad code can survive on good machines” by Fraz Hassan
Best Practice analyzer tools
Microsoft has introduced some useful analyzer tools which will review your code and will point out areas where best practices are not followed. Microsoft FxCop and Microsoft SQL Server Best Practice Analyzer are good examples.
Acknowledgement
Special thanks to my friend Fraz Hassan (Fraz.Hassan@systemsltd.com); we worked together to identify and solve the performance issues successfully using the tools and techniques discussed in this article.
References
http://www.extremeexperts.com
http://www.windowsitlibrary.com
http://www.sql-server-performance.com
http://msdn.microsoft.com
http://www.windojitsu.com
Sajid is currently working in Visionet Systems Inc. NJ USA as & senior .NET developer and member of Technical Design group.He is working in .NET and Microsoft technologies since 2001.
Sajid has Masters Degree in Computer Science from Quaid-i-Azam University, Islamabad, a leading university in Pakistan.


 General
  News
News  Suggestion
  Question
  Bug
Bug  Answer
  Joke
Joke  Praise
  Rant
Rant  Admin
Admin 


