Introduction
Graphs on websites are an effective way of showing statistical data. And viewers can very easily find the trends.
Now displaying data through plug-ins like Flash and Silverlight can be a very expensive operation. The client needs to have Flash, Silverlight or any other plug-in, and the graph file will be downloaded in client browser that will slow down the process. And complicated code is required in addition to understanding the actual user requirements.
To overcome all the issues and achieving a custom developed graph, HTML and JavaScript enabled Graph is the easiest and most efficient solution.
To demonstrate this, I have taken a very complicated Graph that will have Temperature, Pulse, Respiratory and BP.
- All vitals in one graph
- Every vital with different defined ranges
- Different color codes
- Date wise and time wise
- Lines in between the values
- Values in the point with color codes
- If the value is zero, it should not show
All the techniques implementation is completed using simple techniques.
Graph
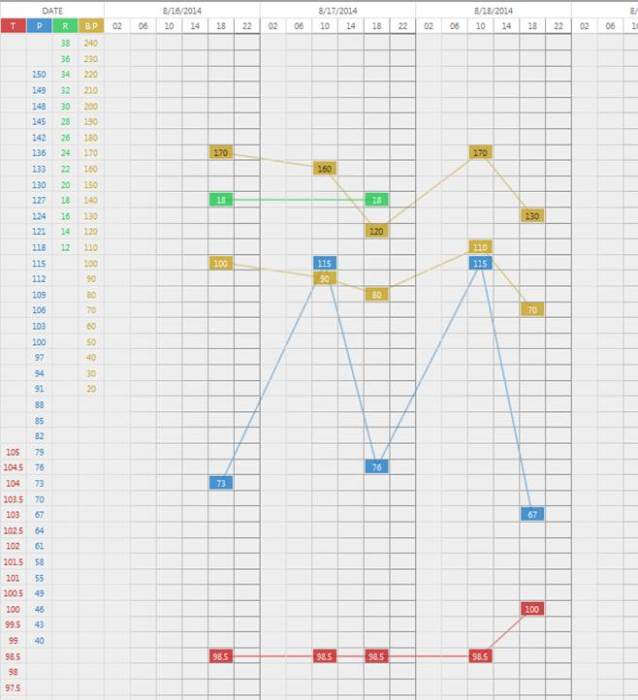
The above graph shows Temperature, Pulse, Respiratory and BP. All in one graph for multiple dates on different times
CSS
<style type="text/css">

        #patientchart
        {
            width: 100%;
            height: 500px;
        }

        .charthead
        {
            position: fixed;
            background-color: #FFF;
            top: 180px;
            z-index: 100 !important;
        }

        .graphline
        {
            padding: 0px;
            margin: 0px;
            line-height: 1px;
            position: absolute;
            z-index: -1 !important;
            opacity: 0.5;
            filter: alpha(opacity=50);
        }

        .chart
        {
            border-left: 1px solid #DDD;
            border-top: 1px solid #DDD;
        }
        .chart td
        {
            font-size: 13px;
            border-right: 1px solid #DDD;
            border-bottom: 1px solid #DDD;
            text-align: center;
            width: 33px !important;
        }

        .pl
        {
            color: #1F7BC6;
        }
        .tl
        {
            color: #C61F1F;
        }
        .rl
        {
            color: #1FC64E;
        }
        .bp
        {
            color: #C69F1F;
        }

        .plh
        {
            background-color: #1F7BC6;
            color: #FFF;
            opacity: 0.8;
            filter: alpha(opacity=80);
        }
        .tlh
        {
            background-color: #C61F1F;
            color: #FFF;
            opacity: 0.8;
            filter: alpha(opacity=80);
        }
        .rlh
        {
            background-color: #1FC64E;
            color: #FFF;
            opacity: 0.8;
            filter: alpha(opacity=80);
        }
        .bph
        {
            background-color: #C69F1F;
            color: #FFF;
            opacity: 0.8;
            filter: alpha(opacity=80);
        }
        .sbph
        {
            background-color: #C69F1F;
            color: #000;
            opacity: 0.8;
            filter: alpha(opacity=80);
        }

        .c02
        {
            border-right-color: #DDD !important;
            border-bottom-color: #DDD !important;
        }
        .c06
        {
            border-right-color: #CCC !important;
            border-bottom-color: #CCC !important;
        }
        .c10
        {
            border-right-color: #BBB !important;
            border-bottom-color: #BBB !important;
        }
        .c14
        {
            border-right-color: #AAA !important;
            border-bottom-color: #AAA !important;
        }
        .c18
        {
            border-right-color: #999 !important;
            border-bottom-color: #999 !important;
        }
        .c22
        {
            border-right-color: #888 !important;
            border-bottom-color: #888 !important;
        }

        #dummyheader
        {
            height: 50px;
        }
    </style>
JavaScript
<script type="text/javascript">
function generateChartData() {
generateReport();
var listLength = VL.length;
if (listLength < 1) {
return;
}
var ctbl = '<div id="dummyheader" />';
ctbl += '<div id="detgr"></div><table class="chart charthead"
cellspacing="0" id="chartheader"><tr><td colspan="4">DATE</td>';
var firstDate = new Date(VL[0].date);
var range = 4;
var startDate = new Date(VL[listLength - 1].date);
startDate.setDate(startDate.getDate() - range);
startDate.setDate(startDate.getDate() + 1);
if (firstDate > startDate) {
startDate = firstDate;
}
var DATE = '';
for (i = 0; i < range; i++) {
var newDate = new Date(startDate);
newDate.setDate(newDate.getDate() + i);
DATE = GetFormatedDate(newDate);
ctbl += '<td colspan="6">' + DATE + '</td>';
}
ctbl += '</tr>';
ctbl += '<tr><td class="tlh">T</td><td class="plh">
P</td><td class="rlh">R</td><td class="bph">B.P</td>';
var HRS = [];
HRS.push('02');
HRS.push('06');
HRS.push('10');
HRS.push('14');
HRS.push('18');
HRS.push('22');
for (ti = 0; ti < range; ti++) {
for (hi = 0; hi < HRS.length; hi++) {
ctbl += '<td class="c' + HRS[hi] + '">' + HRS[hi] + '</td>';
}
}
ctbl += '</tr></table>';
ctbl += '<div class="detdiv" id="detd"><table class="chart"
style="z-index:-2 !important" cellspacing="0">'
generateRanges();
var RESVAL = '';
var idx = 0;
EPL = [];
ETL = [];
ERL = [];
ESBP = [];
EDBP = [];
for (ri = 0; ri <= 45; ri++) {
ctbl += '<tr><td class="tl">' + (TL[ri].val == 0 ? "" : TL[ri].val) +
'</td><td class="pl">' + (PL[ri].val == 0 ? "" : PL[ri].val) +
'</td><td class="rl">' + (RL[ri].val == 0 ? "" : RL[ri].val) +
'</td><td class="bp">' + (BP[ri].val == 0 ? "" : BP[ri].val) + '</td>';
for (ii = 0; ii < range; ii++) {
var newDate = new Date(startDate);
newDate.setDate(newDate.getDate() + ii);
for (ihi = 0; ihi < HRS.length; ihi++) {
RESVAL = '';
for (vi = 0; vi < listLength; vi++) {
if (GetFormatedDate(VL[vi].date) == GetFormatedDate(newDate)) {
var id = new Date(VL[vi].date);
if (id.getHours() == (HRS[ihi] * 1)) {
RESVAL = getVTL(vi, idx);
}
}
}
ctbl += '<td class="c' + HRS[ihi] + '">' + RESVAL + '</td>';
}
}
ctbl += '</tr>';
idx++;
}
ctbl += '</table></div>';
$('#patientchart').html(ctbl);
drawGraphs();
$(window).scroll(function () {
var head = $(window).scrollTop();
if (head > 180) {
$('#chartheader').css('top', '0px');
} else {
head = 175 - head;
$('#chartheader').css('top', head + 'px');
}
});
}
function GetFormatedDate(date) {
var dt = new Date(date);
return (dt.getMonth() + 1) + '/' + dt.getDate() + '/' + dt.getFullYear();
}
function GetFormatedDateTime(date) {
var dt = new Date(date);
return (dt.getMonth() + 1) + '/' + dt.getDate() + '/' + dt.getFullYear() + ' ' + dt.getHours();
}
var VL = [];
var PL = [];
var TL = [];
var RL = [];
var BP = [];
function generateReport() {
var list = $('#HF_Vitals').val().split('||');
VL = [];
if (list.length < 1) {
return;
}
for (vi = 0; vi < list.length; vi++) {
var row = list[vi].split('|');
VL.push({ date: row[0],
dbp: Math.round(row[1]),
pul: Math.round(row[2]),
res: Math.round(row[3]),
sbp: Math.round(row[4]),
temp: row[5] * 1,
counter: Math.round(row[6])
});
}
}
function generateRanges() {
PL = [];
TL = [];
RL = [];
BP = [];
PL.push({ ri: 0, val: 0 });
PL.push({ ri: 1, val: 0 });
PL.push({ ri: 2, val: 0 });
PL.push({ ri: 3, val: 150 });
PL.push({ ri: 4, val: 149 });
PL.push({ ri: 5, val: 148 });
PL.push({ ri: 6, val: 145 });
PL.push({ ri: 7, val: 142 });
PL.push({ ri: 8, val: 136 });
PL.push({ ri: 9, val: 133 });
PL.push({ ri: 10, val: 130 });
PL.push({ ri: 11, val: 127 });
PL.push({ ri: 12, val: 124 });
PL.push({ ri: 13, val: 121 });
PL.push({ ri: 14, val: 118 });
PL.push({ ri: 15, val: 115 });
PL.push({ ri: 16, val: 112 });
PL.push({ ri: 17, val: 109 });
PL.push({ ri: 18, val: 106 });
PL.push({ ri: 19, val: 103 });
PL.push({ ri: 20, val: 100 });
PL.push({ ri: 21, val: 97 });
PL.push({ ri: 22, val: 94 });
PL.push({ ri: 23, val: 91 });
PL.push({ ri: 24, val: 88 });
PL.push({ ri: 25, val: 85 });
PL.push({ ri: 26, val: 82 });
PL.push({ ri: 27, val: 79 });
PL.push({ ri: 28, val: 76 });
PL.push({ ri: 29, val: 73 });
PL.push({ ri: 30, val: 70 });
PL.push({ ri: 31, val: 67 });
PL.push({ ri: 32, val: 64 });
PL.push({ ri: 33, val: 61 });
PL.push({ ri: 34, val: 58 });
PL.push({ ri: 35, val: 55 });
PL.push({ ri: 36, val: 49 });
PL.push({ ri: 37, val: 46 });
PL.push({ ri: 38, val: 43 });
PL.push({ ri: 39, val: 40 });
PL.push({ ri: 40, val: 0 });
PL.push({ ri: 41, val: 0 });
PL.push({ ri: 42, val: 0 });
PL.push({ ri: 43, val: 0 });
PL.push({ ri: 44, val: 0 });
PL.push({ ri: 45, val: 0 });
TL.push({ ri: 0, val: 0 });
TL.push({ ri: 1, val: 0 });
TL.push({ ri: 2, val: 0 });
TL.push({ ri: 3, val: 0 });
TL.push({ ri: 4, val: 0 });
TL.push({ ri: 5, val: 0 });
TL.push({ ri: 6, val: 0 });
TL.push({ ri: 7, val: 0 });
TL.push({ ri: 8, val: 0 });
TL.push({ ri: 9, val: 0 });
TL.push({ ri: 10, val: 0 });
TL.push({ ri: 11, val: 0 });
TL.push({ ri: 12, val: 0 });
TL.push({ ri: 13, val: 0 });
TL.push({ ri: 14, val: 0 });
TL.push({ ri: 15, val: 0 });
TL.push({ ri: 16, val: 0 });
TL.push({ ri: 17, val: 0 });
TL.push({ ri: 18, val: 0 });
TL.push({ ri: 19, val: 0 });
TL.push({ ri: 20, val: 0 });
TL.push({ ri: 21, val: 0 });
TL.push({ ri: 22, val: 0 });
TL.push({ ri: 23, val: 0 });
TL.push({ ri: 24, val: 0 });
TL.push({ ri: 25, val: 0 });
TL.push({ ri: 26, val: 0 });
TL.push({ ri: 27, val: 105.0 });
TL.push({ ri: 28, val: 104.5 });
TL.push({ ri: 29, val: 104.0 });
TL.push({ ri: 30, val: 103.5 });
TL.push({ ri: 31, val: 103.0 });
TL.push({ ri: 32, val: 102.5 });
TL.push({ ri: 33, val: 102.0 });
TL.push({ ri: 34, val: 101.5 });
TL.push({ ri: 35, val: 101.0 });
TL.push({ ri: 36, val: 100.5 });
TL.push({ ri: 37, val: 100.0 });
TL.push({ ri: 38, val: 99.5 });
TL.push({ ri: 39, val: 99.0 });
TL.push({ ri: 40, val: 98.5 });
TL.push({ ri: 41, val: 98.0 });
TL.push({ ri: 42, val: 97.5 });
TL.push({ ri: 43, val: 97.0 });
TL.push({ ri: 44, val: 96.5 });
TL.push({ ri: 45, val: 96.0 });
RL.push({ ri: 0, val: 40 });
RL.push({ ri: 1, val: 38 });
RL.push({ ri: 2, val: 36 });
RL.push({ ri: 3, val: 34 });
RL.push({ ri: 4, val: 32 });
RL.push({ ri: 5, val: 30 });
RL.push({ ri: 6, val: 28 });
RL.push({ ri: 7, val: 26 });
RL.push({ ri: 8, val: 24 });
RL.push({ ri: 9, val: 22 });
RL.push({ ri: 10, val: 20 });
RL.push({ ri: 11, val: 18 });
RL.push({ ri: 12, val: 16 });
RL.push({ ri: 13, val: 14 });
RL.push({ ri: 14, val: 12 });
RL.push({ ri: 15, val: 0 });
RL.push({ ri: 16, val: 0 });
RL.push({ ri: 17, val: 0 });
RL.push({ ri: 18, val: 0 });
RL.push({ ri: 19, val: 0 });
RL.push({ ri: 20, val: 0 });
RL.push({ ri: 21, val: 0 });
RL.push({ ri: 22, val: 0 });
RL.push({ ri: 23, val: 0 });
RL.push({ ri: 24, val: 0 });
RL.push({ ri: 25, val: 0 });
RL.push({ ri: 26, val: 0 });
RL.push({ ri: 27, val: 0 });
RL.push({ ri: 28, val: 0 });
RL.push({ ri: 29, val: 0 });
RL.push({ ri: 30, val: 0 });
RL.push({ ri: 31, val: 0 });
RL.push({ ri: 32, val: 0 });
RL.push({ ri: 33, val: 0 });
RL.push({ ri: 34, val: 0 });
RL.push({ ri: 35, val: 0 });
RL.push({ ri: 36, val: 0 });
RL.push({ ri: 37, val: 0 });
RL.push({ ri: 38, val: 0 });
RL.push({ ri: 39, val: 0 });
RL.push({ ri: 40, val: 0 });
RL.push({ ri: 41, val: 0 });
RL.push({ ri: 42, val: 0 });
RL.push({ ri: 43, val: 0 });
RL.push({ ri: 44, val: 0 });
RL.push({ ri: 45, val: 0 });
BP.push({ ri: 0, val: 250 });
BP.push({ ri: 1, val: 240 });
BP.push({ ri: 2, val: 230 });
BP.push({ ri: 3, val: 220 });
BP.push({ ri: 4, val: 210 });
BP.push({ ri: 5, val: 200 });
BP.push({ ri: 6, val: 190 });
BP.push({ ri: 7, val: 180 });
BP.push({ ri: 8, val: 170 });
BP.push({ ri: 9, val: 160 });
BP.push({ ri: 10, val: 150 });
BP.push({ ri: 11, val: 140 });
BP.push({ ri: 12, val: 130 });
BP.push({ ri: 13, val: 120 });
BP.push({ ri: 14, val: 110 });
BP.push({ ri: 15, val: 100 });
BP.push({ ri: 16, val: 90 });
BP.push({ ri: 17, val: 80 });
BP.push({ ri: 18, val: 70 });
BP.push({ ri: 19, val: 60 });
BP.push({ ri: 20, val: 50 });
BP.push({ ri: 21, val: 40 });
BP.push({ ri: 22, val: 30 });
BP.push({ ri: 23, val: 20 });
BP.push({ ri: 24, val: 0 });
BP.push({ ri: 25, val: 0 });
BP.push({ ri: 26, val: 0 });
BP.push({ ri: 27, val: 0 });
BP.push({ ri: 28, val: 0 });
BP.push({ ri: 29, val: 0 });
BP.push({ ri: 30, val: 0 });
BP.push({ ri: 31, val: 0 });
BP.push({ ri: 32, val: 0 });
BP.push({ ri: 33, val: 0 });
BP.push({ ri: 34, val: 0 });
BP.push({ ri: 35, val: 0 });
BP.push({ ri: 36, val: 0 });
BP.push({ ri: 37, val: 0 });
BP.push({ ri: 38, val: 0 });
BP.push({ ri: 39, val: 0 });
BP.push({ ri: 40, val: 0 });
BP.push({ ri: 41, val: 0 });
BP.push({ ri: 42, val: 0 });
BP.push({ ri: 43, val: 0 });
BP.push({ ri: 44, val: 0 });
BP.push({ ri: 45, val: 0 });
}
var EPL = [];
var ETL = [];
var ERL = [];
var ESBP = [];
var EDBP = [];
function getVTL(vi, idx) {
var resval = '';
var vt = VL[vi];
var did = vt.counter;
if (vt.dbp > 0) {
if (BP[idx].val == VL[vi].dbp) {
resval += '<div class="bph" id="bp_' + did + '">' + (vt.dbp * 1) + '</div>';
EDBP.push(did);
}
}
if (vt.pul > 0) {
if (PL[idx].val == vt.pul) {
resval += '<div class="plh" id="pul_' + did + '">' + vt.pul + '</div>';
EPL.push(did);
}
}
if (VL[vi].res > 0) {
if (RL[idx].val == vt.res) {
resval += '<div class="rlh" id="res_' + did + '">' + vt.res + '</div>';
ERL.push(did);
}
}
if (vt.sbp > 0) {
if (BP[idx].val == vt.sbp) {
resval += '<div class="sbph" id="sbp_' + did + '">' + (vt.sbp * 1) + '</div>';
ESBP.push(did);
}
}
if (vt.temp > 0) {
if (TL[idx].val == vt.temp) {
resval += '<div class="tlh" id="temp_' + did + '">' + vt.temp + '</div>';
ETL.push(did);
}
}
return resval;
}
function sortNumber(a, b) {
return a - b;
}
function drawGraphs() {
var div1 = '';
var div2 = '';
var idx = 0;
var str = '';
EDBP.sort(sortNumber);
EPL.sort(sortNumber);
ERL.sort(sortNumber);
ESBP.sort(sortNumber);
ETL.sort(sortNumber);
for (i = 0; i <= EDBP.length + 1; i++) {
str += EDBP[i] + ',';
div1 = 'bp_' + EDBP[i];
div2 = 'bp_' + EDBP[i + 1];
connect(div1, div2, '#c69f1f', 2);
}
for (i = 0; i <= EPL.length + 1; i++) {
div1 = 'pul_' + EPL[i];
div2 = 'pul_' + EPL[i + 1];
connect(div1, div2, '#1f7bc6', 2);
}
for (i = 0; i <= ERL.length + 1; i++) {
div1 = 'res_' + ERL[i];
div2 = 'res_' + ERL[i + 1];
connect(div1, div2, '#1fc64e', 2);
}
for (i = 0; i <= ESBP.length + 1; i++) {
div1 = 'sbp_' + ESBP[i];
div2 = 'sbp_' + ESBP[i + 1];
connect(div1, div2, '#c69f1f', 2);
}
for (i = 0; i < ETL.length + 1; i++) {
div1 = 'temp_' + ETL[i];
div2 = 'temp_' + ETL[i + 1];
connect(div1, div2, '#c61f1f', 2);
}
}
function getOffset(el) {
if (el == null) {
return;
}
var _x = 0;
var _y = 0;
var _w = el.offsetWidth | 0;
var _h = el.offsetHeight | 0;
while (el && !isNaN(el.offsetLeft) && !isNaN(el.offsetTop)) {
_x += el.offsetLeft - el.scrollLeft;
_y += el.offsetTop - el.scrollTop;
el = el.offsetParent;
}
return { top: _y, left: _x, width: _w, height: _h };
}
function connect(d1, d2, color, thickness) {
var div1 = document.getElementById(d1);
var div2 = document.getElementById(d2);
if (div1 == null || div2 == null) {
return;
}
var off1 = getOffset(div1);
var off2 = getOffset(div2);
var x1 = off1.left + (off1.width / 2);
var y1 = off1.top + (off1.height / 2);
var x2 = off2.left + (off2.width / 2);
var y2 = off2.top + (off2.height / 2);
var length = Math.sqrt(((x2 - x1) * (x2 - x1)) + ((y2 - y1) * (y2 - y1)));
var cx = ((x1 + x2) / 2) - (length / 2);
var cy = ((y1 + y2) / 2) - (thickness / 2);
var angle = Math.atan2((y1 - y2), (x1 - x2)) * (180 / Math.PI);
var htmlLine = "<div class='graphline' style=' height:" +
thickness + "px; background-color:" + color + "; left:" + cx +
"px; top:" + cy + "px; width:" + length + "px; -moz-transform:rotate
(" + angle + "deg); -webkit-transform:rotate(" + angle + "deg);
-o-transform:rotate(" + angle + "deg);
-ms-transform:rotate(" + angle + "deg); transform:rotate(" + angle + "deg);' />";
document.body.innerHTML += htmlLine;
}
</script>
HTML Code
<input name="HF_Vitals" id="HF_Vitals"
value="Saturday, August 16, 2014 6:00:00 PM | 100.00| 73.00| 18.00|  170.00| 98.50| 0||Sunday, August 17, 2014 10:00:00 AM|90.00|115.00|0|160.00|98.50|1||Sunday, August 17, 2014 6:00:00 PM|80.00|76.00|18.00|120.00|98.50|2||Monday, August 18, 2014 10:00:00 AM|110.00|115.00|0|170.00|98.50|3||Monday, August 18, 2014 6:00:00 PM|70.00|67.00|0|130.00|100.00|4"
type="hidden" />

<input type="button" id="btn_showgraph"
value="Show Graph" onclick="generateChartData()" />

<div id="patientchart"></div>
Working in the field of software development from the past 9 years, love to work in databases and writing applications for large enterprises, experienced in medical and financial sectors.
Believes that software development is the most beautiful work in the world.


 General
  News
News  Suggestion
  Question
  Bug
Bug  Answer
  Joke
Joke  Praise
  Rant
Rant  Admin
Admin 


