GeoJSON offers a fun and easy way to learn how to quickly build a mapping application with location data. In this article, you’ll use earthquake data from the U.S. Geological Survey (USGS) to display and analyze earthquakes around the world.
Before getting started, be sure to check out this Quick Start guide to get signed up for a free ArcGIS for Developers subscription. The article is fairly high-level to keep things moving; if you want to dig into the details, there are links at the end.
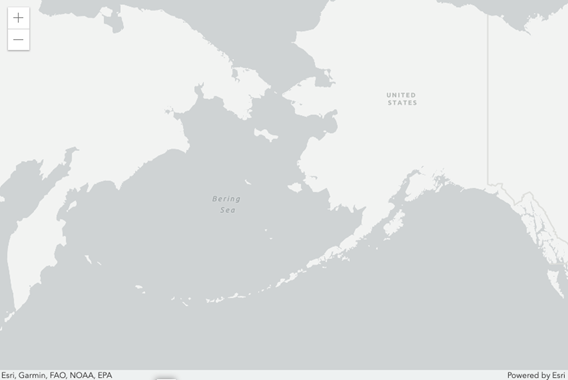
Hello World Map
For the first step, let’s create a basic mapping application using the ArcGIS API for JavaScript as the mapping engine. This will be a 2D map, but you can also easily use 2D data to create 3D visualizations.
Copy the code below into the IDE or text editor of your choice and save it as an .html file (e.g., index.html), or you can also fork this CodePen example, and then use it for the rest of the steps in the article: https://codepen.io/andygup/pen/mNyNLY.
<!DOCTYPE html>
<html>
<head>
<meta charset="utf-8" />
<meta name="viewport" content="initial-scale=1,maximum-scale=1,user-scalable=no" />
<title>Hello World Map</title>
<style>
html,
body,
#viewDiv {
padding: 0;
margin: 0;
height: 100%;
width: 100%;
}
</style>
<link rel="stylesheet" href="https://js.arcgis.com/4.12/esri/themes/light/main.css" />
<script src="https://js.arcgis.com/4.12/"></script>
<script>
require(["esri/Map", "esri/views/MapView"], (Map, MapView) => {
let map = new Map({
basemap: "gray-vector"
});
let view = new MapView({
container: "viewDiv",
map: map,
zoom: 3,
center: [-168, 60]
});
});
</script>
</head>
<body>
<div id="viewDiv"></div>
</body>
</html>
You should see a basic map that looks like this:
Display GeoJSON Data
Now this is where the fun really begins – adding the GeoJSON data. To do this you’ll add a layer to the map that will automatically display the earthquake data when the app loads. In this case, we’ll be using GeoJSONLayer which is specific designed for working with GeoJSON data.
Starting with the code from our Hello World Map app, in the require statement add a reference to the GeoJSONLayer module, and add its alias in the callback function:
require([
"esri/Map",
"esri/views/MapView",
"esri/layers/GeoJSONLayer"],
(Map, MapView, GeoJSONLayer) => {
Next, directly above the Map initialization code create the GeoJSONLayer like this:
const geoJSONLayer = new GeoJSONLayer({
  url: "https://earthquake.usgs.gov/earthquakes/feed/v1.0/summary/1.0_month.geojson",
  copyright: "USGS Earthquakes"
});
And then add the new geoJSONLayer object to the Map.layers property:
const map = new Map({
  basemap: "gray",
  layers: [geoJSONLayer]
});
Just a quick note: If your GeoJSON files are served from a separate domain that doesn’t support CORS, then you’ll need a proxy in order for your app to load the files.
Depending on your network speed, it may take a few seconds to retrieve and load the GeoJSON. You should see a map that looks similar to this:

Adjust the Symbol Size by Magnitude
Now you can start to spice up the visualization by customizing the circle symbols so that they are made larger or smaller based on the earthquake’s magnitude.
In the app, directly above where you initialized GeoJSONLayer, go ahead and add a simple renderer. SimpleRenderer is one of several different types of renderers that are used to create powerful visualizations. It renders all features in a layer with a single type of symbol – in this case, we are using a circle symbol. In order to adjust the circle symbols size, we’ll use visualVariables inside the renderer. Visual variables are used in conjunction with renderers to apply themes across the entire dataset based on color, size, opacity, and rotation.
For our map, all we need to do is add a size type to the visualVariables, and then define the stops values. Earthquake magnitude values that fall between the stops are proportionately assigned a size that ranges from 4px to 40px.
const renderer = {
  type: "simple",
  field: "mag",
  symbol: {
    type: "simple-marker",
    color: "orange",
    outline: {
      color: "white"
    }
  },
  visualVariables: [
    {
      type: "size",
      field: "mag",
      stops: [
        {
          value: 2.5,
          size: "4px"
        },
        {
          value: 8,
          size: "40px"
        }
      ]
    }
  ]
};
And go ahead and attach the renderer object to GeoJSONLayer.renderer property. The render will then do all the heavy lifting:
const geoJSONLayer = new GeoJSONLayer({
url: "https://earthquake.usgs.gov/earthquakes/feed/v1.0/summary/1.0_month.geojson",
copyright: "USGS Earthquakes",
renderer: renderer
});
Now your app should look like this:
Create a Color Ramp for the Earthquake Symbols
To add even more visual context, let’s give the circle symbols a range of colors based on increasing magnitude. This time we’ll add a color type to the visualVariables and then define the color stops. Earthquake magnitude values that fall between the stops will now be proportionately assigned a color that ranges from orange to darkred.
const renderer = {
type: "simple",
field: "mag",
symbol: {
type: "simple-marker",
color: "orange",
outline: {
color: "white"
}
},
visualVariables: [
{
type: "size",
field: "mag",
stops: [
{
value: 2.5,
size: "4px"
},
{
value: 8,
size: "40px"
}
]
},
{
type: "color",
field: "mag",
stops: [
{
value: 2.5,
color: "orange"
},
{
value: 8,
color: "darkred"
}
]
}
]
};
Your map should now look something like this:
Display a Popup
We also want to be able to explore the map by clicking on the different earthquakes and discovering detailed information. To do this, you’ll need to add a popup to map. Above the SimpleRenderer, add the following code to configure the data that will be displayed inside the popup, we call this object a popupTemplate:
const popupTemplate = {
  title: "Earthquake Info",
  content: "Magnitude {mag} {type} hit {place} on {time}",
  fieldInfos: [
    {
      fieldName: "time",
      format: {
        dateFormat: "short-date-short-time"
      }
    }
  ]
};
Next, add the popupTemplate to the GeoJSONLayer.popupTemplate property like this:
const geoJSONLayer = new GeoJSONLayer({
url: "https://earthquake.usgs.gov/earthquakes/feed/v1.0/summary/1.0_month.geojson",
copyright: "USGS Earthquakes",
renderer: renderer,
popupTemplate: popupTemplate
});
That’s all you need to do. Now when you click on an earthquake symbol, you should see a popup similar to this:
Wrap Up
If you want to see the full, completed app live, then click here.
Hopefully you enjoyed this tutorial. With just a few lines of code you learned how to display geographic earthquake data from a GeoJSON file, saw how to symbolize using a renderer and build a color ramp, and you added a popup so that you can explore information about individual earthquakes.
If you haven’t signed up for a free ArcGIS Developer Subscription yet, here’s just a sampling of the many things you can do with one:
- Use of all of Esri's APIs and SDKs for web, native, and mobile platforms
- 1,000,000 basemaps and geosearch transactions per month
- Credits towards generating routes
- Unlimited non-revenue generating apps
- Unlimited users
- Access to a wide selection of rich, geographic content and services hosted in ArcGIS Online
- Style basemaps and manage your map content
- Host, query, and analyze geographic content
Extra Credit
For extra credit, upload the GeoJSON file to ArcGIS Online and convert it into a hosted feature service. Feature services have significant advantages over static files including faster loading performance, especially for large data sets, the ability to store changes to the data attributes and share them via the service, access management control, and more. Here’s a tutorial to get you started: https://developers.arcgis.com/labs/arcgisonline/import-data/. And, then use a FeatureLayer to load the data onto the map instead of GeoJSONLayer.
If you want to dig further into the APIs’ capabilities, there are over two dozen, 10-minute tutorials, hundreds of samples, a guide of overview topics, as well as a detailed API reference at https://developers.arcgis.com/javascript/.
I’m a technical product manager for the ArcGIS API for JavaScript. My passion is web mapping APIs and I’ve been involved with building and implementing them since almost the beginning.


 General
  News
News  Suggestion
  Question
  Bug
Bug  Answer
  Joke
Joke  Praise
  Rant
Rant  Admin
Admin 


