Data modelling is a pivotal skill that every practitioner in data management should acquire. That said, there are numerous tools that can be used to model data. As a Certified Microsoft Professional, my default modelling tool has always been Microsoft (MS) Visio and sometimes, Visual Studio. However, I’ve recently been introduced to Lucidchart and it completely blew my mind. Thus, this blog post is a comparison piece on basic dimensional modelling in MS Visio versus Lucidchart.
Case Study
I find it much easier to explain something using case studies. So, this blog post’s case in point is that of dimensional modelling an application that allows consumers to purchase delicious fruits via an e-commerce website platform. There are several comparisons that could be done on MS Visio vs. Lucidchart such as pricing models, accessibility of the tool via mobile platforms, collaboration etc. However, for the purposes of keeping things basic – my comparisons will focus on modelling the aforementioned case study using Crow’s foot notation:
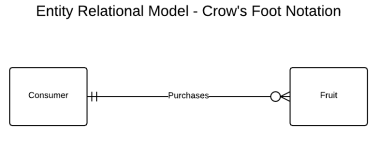
The Entity Relational Model for our case study could look as shown below:

Dimensional Modelling in Visio
Step 1: Launch MS Visio
Step 2: Select Crow’s Foot Database Notation template under the Software category as shown below:

Step 3: Drag 4 Entities to the blank window
Step 4: Rename Entities to DimConsumer, DimDate, DimFruit, and FactPurchases as shown below:

Step 5: Join DimConsumer, DimDate, DimFruit entities to FactPurchases
Step 6: Add attributes to entities as shown below:

Dimensional Modelling in Lucidchart
Step 1: Launch Lucidchart
Step 2: Create New Document
Unlike MS Visio whereby you are redirected to a blank document, Lucidchart gives you an option to setup a new document from scratch (blank document) or use an existing template i,e, Hockey ERD:

Step 3: Delete all entities until you are left with 4 entities in a T-Shape as shown below:

Step 4: Rename Entities to DimConsumer, DimDate, DimFruit, and FactPurchases
Step 5: Remove/add attributes until your document looks like below:

Conclusion
Although modelling our case study using both MS Visio and Lucidchart seemed to have taken similar number of steps – modelling using MS Visio took significantly longer. For instance adding attributes in FactPurchases meant dragging and dropping attribute stencil several times whereas in Lucidchart you just needed to increase the fields counter value from 3 to 6 as shown below:

The second part of this blog will focus more on key differences of dimensional modelling using two applications. CodeProject
Sifiso W. Ndlovu is a certified Microsoft professional who holds a Master’s degree in IT Management from the University of Johannesburg. He specializes on a range of enterprise and consumer technologies using open source and proprietary software. He is the member of the Johannesburg SQL User Group wherein he has made several presentations on User Group Meetings and SQL Saturday sessions. He has written for a number of publications including SQLShack.com and SQLServerCentral.com.


