Introduction
In this article, I will show you how to perform all the calculations related to the statistics analysis technic known as correspondence analysis.
The code provided with the article is a Windows Forms application, although usually you will want to put the code into a class library along with some others classes regarding maths calculations. Doing so in this case is quite easy, as almost all the code provided is involved in the correspondence analysis calculations, so it is only a copy & paste work.
For readability, the code is divided in three steps, although you can put it all together in a single function. The first step is load the data from a csv file and calculate the mass of the files and columns. Next, calculations are performed to get the chi distance and inertia. Finally, the data is projected on a two dimnsion subspace in order to be drawn in a graphic chart.
A simple example of graph drawing is also provided along with the math code.
Background
I supose that you know what the correspondence analysis is. If is not the case, you can visit my blog (http://software-tecnico-libre.es/en/article-by-topic/software-developing/charp-programming/mathematics-with-csharp/correspondence-analysis-csharp) for a brief explanation of this technique related with the code in this article.
Basically consists on the optimal scaling of the data on a contingency table so you can view the relationshps between categorical data as if it was continuous, allowing to generate graphic maps where the different rows and columns are represented and you can find some not obvious relationship between them.
Using the code
First, let's begin making a review of the global data used in the code. The main variable is _data, which is a DataTable that will contain the contingency table, along with the calculations of the correspondence analysis for rows and columns and the principal and standard coordinates to plot the graph in two dimensions.
private DataTable _data = null;
The size of the contingency table is in the following variables:
private int _colCount = 0;
private int _rowCount = 0;
As a readability helpers, I define two enumerations to identify the different columns and rows containing calculated values.
public enum ColumnPosition
{
	RowNames, FirstDataColumn, Mass, ChiDist, Inertia, Dim1RowStandard, Dim2RowStandard, Dim1RowPrincipal, Dim2RowPrincipal
}

public enum RowPosition
{
	FirstDataRow, Mass, ChiDist, Inertia, Dim1ColStandard, Dim2ColStandard, Dim1ColPrincipal, Dim2ColPrincipal
}
The data in rows and columns will be of type double, except for the row names, which is the first column, that is of string type. The initial contingency table consists of absolute frequencies, with values between 0 and 1.
The rows and columns added to the table (the correspendence analysis is symmetric for rows and columns) are for the mass, or marginal frecuency, the chi distance to the centroid, the inertia and the standard and principal coordinates of each row and column.
With these two helper functions, you can locate each of these rows / columns independently of the size of the contingency table:
private int GetColPosition(ColumnPosition c)
{
	switch (c)
	{
 		case ColumnPosition.RowNames:
                    return 0;
                case ColumnPosition.FirstDataColumn:
                    return 1;
                case ColumnPosition.Mass:
                    return 1 + _colCount;
                case ColumnPosition.ChiDist:
                    return 2 + _colCount;
                case ColumnPosition.Inertia:
                    return 3 + _colCount;
                case ColumnPosition.Dim1RowStandard:
                    return 4 + _colCount;
                case ColumnPosition.Dim2RowStandard:
                    return 5 + _colCount;
                case ColumnPosition.Dim1RowPrincipal:
                    return 6 + _colCount;
                case ColumnPosition.Dim2RowPrincipal:
                    return 7 + _colCount;
        }
	throw new ArgumentException();
}

private int GetRowPosition(RowPosition r)
{
	switch (r)
        {
                case RowPosition.FirstDataRow:
                    return 0;
                case RowPosition.Mass:
                    return _rowCount;
                case RowPosition.ChiDist:
                    return 1 + _rowCount;
                case RowPosition.Inertia:
                    return 2 + _rowCount;
                case RowPosition.Dim1ColStandard:
                    return 3 + _rowCount;
                case RowPosition.Dim2ColStandard:
                    return 4 + _rowCount;
                case RowPosition.Dim1ColPrincipal:
                    return 5 + _rowCount;
                case RowPosition.Dim2ColPrincipal:
                    return 6 + _rowCount;
	}
        throw new ArgumentException();
}
This is how the program looks:
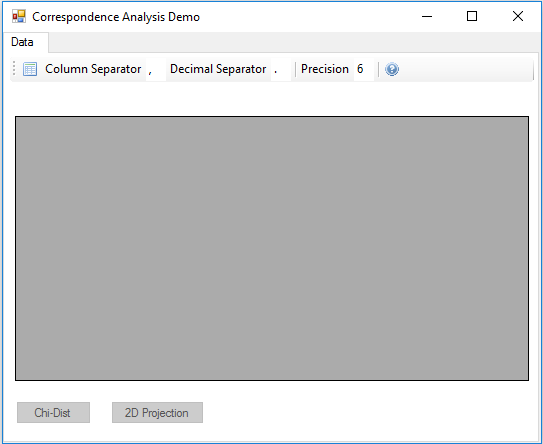
The data files must be in csv format, with the first row containing the column names and the first column the row names, as in the image:

You can provide the character used to separate columns and decimal positions, as well as the precision to round the resulting values, which is stored in the _precision global variable.
private int _precision = 6;
The button on the left of the toolbar allows to select and load a csv file with data, this is the first step of the algorithm. Along with the inicialization of the _data DataTable, the marginal frequencies are calculated and stored in the row and column Mass.
As is in this step where the mass is calculated, besides, the variables used to scale the points in the graph are initialized, these variables are:
private float _rMassSc = 0f;
private float _cMassSc = 0f;
private float _minRMass = 0f;
private float _minCMass = 0f;
I use float values as these variables will be use in calculations for graphics.
For scaling by the mass there is also a constant, which defines the minimum relativa size that a point will have, to avoid print too small points.
private const float _cMinScale = 0.5f;
The code is in the Click event of the button. First, the user interface and local variables are initialized:
StreamReader rdr = new StreamReader(OFDlg.FileName);
bsData.DataSource = null;
bChid.Enabled = false;
bProject2D.Enabled = false;
tbWizzard.TabPages.Remove(tpGraph);
int.TryParse(txtPrec.Text, out _precision);
if ((_precision <= 0) || (_precision > 16))
{
	_precision = 6;
	txtPrec.Text = "6";
}
Then, the data and mass columns are created:
string line = rdr.ReadLine();
...
string[] columns = line.Split(txtSep.Text[0]);
_colCount = columns.Length - 1;
_rowCount = 0;
_data = new DataTable();
_data.Columns.Add(new DataColumn("row/col", typeof(string)));
for (int ix = 1; ix < columns.Length; ix++)
{
_data.Columns.Add(new DataColumn(columns[ix].Replace("\"", ""), typeof(double)));
}
_data.Columns.Add(new DataColumn("Mass", typeof(double)));
Next, the data is read from the file and the row mass and scale calculated:
DataRow row;
double total = 0;
double max = double.MinValue;
double min = double.MaxValue;
while ((line = rdr.ReadLine()) != null)
{
row = _data.NewRow();
string[] rowdata = line.Split(txtSep.Text[0]);
row[GetColPosition(ColumnPosition.RowNames)] = rowdata[0].Replace("\"", "");
double rtotal = 0;
for (int ix = GetColPosition(ColumnPosition.FirstDataColumn); ix < rowdata.Length; ix++)
{
double v = Convert.ToDouble(rowdata[ix].Replace(txtDecSep.Text, CultureInfo.CurrentCulture.NumberFormat.NumberDecimalSeparator));
total += v;
rtotal += v;
row[ix] = Math.Round(v, _precision);
}
row[GetColPosition(ColumnPosition.Mass)] = Math.Round(rtotal, _precision);
max = Math.Max(rtotal, max);
min = Math.Min(rtotal, min);
_data.Rows.Add(row);
_rowCount++;
}
_minRMass = (float)min;
_rMassSc = (float)((1 - _cMinScale) / (max - min));
To end calculating the column masses and the mass scale for columns.
max = double.MinValue;
min = double.MaxValue;
row = _data.NewRow();
row[0] = "Mass";
for (int ix = 1; ix < _data.Columns.Count - 1; ix++)
{
double ctotal = 0;
for (int ir = 0; ir < _data.Rows.Count; ir++)
{
ctotal += (double)_data.Rows[ir][ix];
}
row[ix] = Math.Round(ctotal, _precision);
max = Math.Max(ctotal, max);
min = Math.Min(ctotal, min);
}
row[GetColPosition(ColumnPosition.Mass)] = Math.Round(total, _precision);
_data.Rows.Add(row);
_minCMass = (float)min;
_cMassSc = (float)((1 - _cMinScale) / (max - min));
The next step is performed when pressing the Chi-Dist button, and consists on calculating the chi distance between rows and columns and its centroids and his derived measure called inertia, which is simmilar to the variance.
The code is the Click event of the button.
First, for each data row, calculates the sum of the square of the differences between the actual proportional value of each data column, which is obtained dividing the absolute frequency by the marginal frequency, and the value of the mass, which is the frequency for the centroid, divided by the value of the mass.
The square root of this sum is the chi distance for the row, and, multiplying this value by the mass, the inertia is obtained.
double inertia = 0;
_data.Columns.Add("Chi-Dist", typeof(double));
_data.Columns.Add("Inertia", typeof(double));
for (int ir = GetRowPosition(RowPosition.FirstDataRow); ir < GetRowPosition(RowPosition.Mass); ir++)
{
double chdrow = 0;
for (int ic = GetColPosition(ColumnPosition.FirstDataColumn); ic < GetColPosition(ColumnPosition.Mass); ic++)
{
chdrow += Math.Pow(((double)_data.Rows[ir][ic] / (double)_data.Rows[ir][GetColPosition(ColumnPosition.Mass)]) - (double)_data.Rows[GetRowPosition(RowPosition.Mass)][ic], 2) / (double)_data.Rows[GetRowPosition(RowPosition.Mass)][ic];
}
_data.Rows[ir][GetColPosition(ColumnPosition.ChiDist)] = Math.Round(Math.Sqrt(chdrow), _precision);
inertia += chdrow * (double)_data.Rows[ir][GetColPosition(ColumnPosition.Mass)];
_data.Rows[ir][GetColPosition(ColumnPosition.Inertia)] = Math.Round(chdrow * (double)_data.Rows[ir][GetColPosition(ColumnPosition.Mass)], _precision);
}
Then, the same calculations are made to add two new rows with the chi distance and inertia of the columns.
The total inertia of the table is the sum of the inertias of the rows (or of the columns, which is equal).
DataRow rowc = _data.NewRow();
rowc[0] = "Chi-Dist";
DataRow rowi = _data.NewRow();
rowi[0] = "Inertia";
for (int ic = GetColPosition(ColumnPosition.FirstDataColumn); ic < GetColPosition(ColumnPosition.Mass); ic++)
{
double chdcol = 0;
for (int ir = GetRowPosition(RowPosition.FirstDataRow); ir < GetRowPosition(RowPosition.Mass); ir++)
{
chdcol += Math.Pow(((double)_data.Rows[ir][ic] / (double)_data.Rows[GetRowPosition(RowPosition.Mass)][ic]) - (double)_data.Rows[ir][GetColPosition(ColumnPosition.Mass)], 2) / (double)_data.Rows[ir][GetColPosition(ColumnPosition.Mass)];
}
rowc[ic] = Math.Round(Math.Sqrt(chdcol), _precision);
rowi[ic] = Math.Round(chdcol * (double)_data.Rows[GetRowPosition(RowPosition.Mass)][ic], _precision);
}
rowi[GetColPosition(ColumnPosition.Inertia)] = Math.Round(inertia, _precision);
_data.Rows.Add(rowc);
_data.Rows.Add(rowi);
The most complex calculation from those involved in the correspondence analysis is the singular value decomposition, or SVD, used to project the n-dimensional profile space in a subspace of two dimensions, in order to draw the graphic, obtaining the standard and principal coordinates for each row and column.
Maybe you have your own library to calculate this decomposition, I have used the class SingularValueDecomposition, on the library Accord.Math, from the NuGet package repository. You can easily change the code to use your preferred software.
Those calculations are performed in the Click event of the 2D Projection button.
First, the S matrix is calculated, in the wdata local variable, the formula is S = Dr-1/2(P - rcT)Dc-1/2, where Dr-1/2 is a diagonal matrix whose diagonal is formed with the inverse of the square root of the mass of the rows. Dc-1/2 is the same for the columns, P is the contingency table, r the diagonal matrix with the mass of the rows and c the diagonal matrix with the mass of the columns.
double[,] wdata = new double[_rowCount, _colCount];
for (int ir = GetRowPosition(RowPosition.FirstDataRow); ir < GetRowPosition(RowPosition.Mass); ir++)
{
        for (int ic = GetColPosition(ColumnPosition.FirstDataColumn); ic < GetColPosition(ColumnPosition.Mass); ic++)
        {
                wdata[ir, ic - 1] = Math.Round(((double)_data.Rows[ir][ic] - (double)_data.Rows[ir][GetColPosition(ColumnPosition.Mass)] * (double)_data.Rows[GetRowPosition(RowPosition.Mass)][ic]) /
                        Math.Sqrt((double)_data.Rows[ir][GetColPosition(ColumnPosition.Mass)] * (double)_data.Rows[GetRowPosition(RowPosition.Mass)][ic]), _precision);
        }
}
The SVD decomposes this matrix in another three, S = UDVT, where U are the left singular vectors, D is a diagonal matrix with the singular values, in descending order, in its diagonal, and V is a matrix with the right singular vectors.
SingularValueDecomposition svd = new SingularValueDecomposition(wdata);
From here, you can get the standard coordinates of each row in the two dimensions taking from the first two left vectors of the U matrix divided by the square root of the mass.
The principal coordinates are calculated multiplying the standard ones by the first two singular values.
_data.Columns.Add("Dim1 S.", typeof(double));
_data.Columns.Add("Dim2 S.", typeof(double));
_data.Columns.Add("Dim1 P.", typeof(double));
_data.Columns.Add("Dim2 P.", typeof(double));
float[,] vmax = new float[2, 4];
for (int ir = GetRowPosition(RowPosition.FirstDataRow); ir < GetRowPosition(RowPosition.Mass); ir++)
{
for (int iu = 0; iu < 2; iu++)
{
double v = svd.LeftSingularVectors[ir, iu] / Math.Sqrt((double)_data.Rows[ir][GetColPosition(ColumnPosition.Mass)]);
_data.Rows[ir][iu + GetColPosition(ColumnPosition.Dim1RowStandard)] = Math.Round(v, _precision);
_data.Rows[ir][iu + GetColPosition(ColumnPosition.Dim1RowPrincipal)] = Math.Round(v * svd.Diagonal[iu], _precision);
vmax[iu, 0] = (float)Math.Min(vmax[iu, 0], Math.Round(v, _precision));
vmax[iu, 1] = (float)Math.Max(vmax[iu, 1], Math.Round(v, _precision));
vmax[iu, 2] = (float)Math.Min(vmax[iu, 2], Math.Round(v * svd.Diagonal[iu], _precision));
vmax[iu, 3] = (float)Math.Max(vmax[iu, 3], Math.Round(v * svd.Diagonal[iu], _precision));
}
}
_rowDimS1 = new SizeF(vmax[0, 0], vmax[0, 1]);
_rowDimS2 = new SizeF(vmax[1, 0], vmax[1, 1]);
_rowDimP1 = new SizeF(vmax[0, 2], vmax[0, 3]);
_rowDimP2 = new SizeF(vmax[1, 2], vmax[1, 3]);
The variables _rowDimS1, _rowDimS2, _rowDimP1 and _rowDimP2 are helpers to draw the graphic. They contain the maximum and minimum coordinates for each dimension.
Next, the same calculations are performed to obtain the coordinates of the columns, but in this case using the right singular vectors, from the V matrix.
DataRow row1s = _data.NewRow();
row1s[0] = "Dim1 S.";
DataRow row2s = _data.NewRow();
row2s[0] = "Dim2 S.";
DataRow row1p = _data.NewRow();
row1p[0] = "Dim1 P.";
DataRow row2p = _data.NewRow();
row2p[0] = "Dim2 P.";
vmax = new float[2, 4];
for (int ic = GetColPosition(ColumnPosition.FirstDataColumn); ic < GetColPosition(ColumnPosition.Mass); ic++)
{
double v1 = svd.RightSingularVectors[ic - 1, 0] / Math.Sqrt((double)_data.Rows[GetRowPosition(RowPosition.Mass)][ic]);
row1s[ic] = Math.Round(v1, _precision);
row1p[ic] = Math.Round(v1 * svd.Diagonal[0], _precision);
vmax[0, 0] = (float)Math.Min(vmax[0, 0], Math.Round(v1, _precision));
vmax[0, 1] = (float)Math.Max(vmax[0, 1], Math.Round(v1, _precision));
vmax[0, 2] = (float)Math.Min(vmax[0, 2], Math.Round(v1 * svd.Diagonal[0], _precision));
vmax[0, 3] = (float)Math.Max(vmax[0, 3], Math.Round(v1 * svd.Diagonal[0], _precision));
double v2 = svd.RightSingularVectors[ic - 1, 1] / Math.Sqrt((double)_data.Rows[GetRowPosition(RowPosition.Mass)][ic]);
row2s[ic] = Math.Round(v2, _precision);
row2p[ic] = Math.Round(v2 * svd.Diagonal[1], _precision);
vmax[1, 0] = (float)Math.Min(vmax[1, 0], Math.Round(v2, _precision));
vmax[1, 1] = (float)Math.Max(vmax[1, 1], Math.Round(v2, _precision));
vmax[1, 2] = (float)Math.Min(vmax[1, 2], Math.Round(v2 * svd.Diagonal[1], _precision));
vmax[1, 3] = (float)Math.Max(vmax[1, 3], Math.Round(v2 * svd.Diagonal[1], _precision));
}
_colDimS1 = new SizeF(vmax[0, 0], vmax[0, 1]);
_colDimS2 = new SizeF(vmax[1, 0], vmax[1, 1]);
_colDimP1 = new SizeF(vmax[0, 2], vmax[0, 3]);
_colDimP2 = new SizeF(vmax[1, 2], vmax[1, 3]);
_data.Rows.Add(row1s);
_data.Rows.Add(row2s);
_data.Rows.Add(row1p);
_data.Rows.Add(row2p);
The last calculation is to project the total inertia of the table in the two dimensions. The difference between the total inertia and the sum of the projected inertias gives you an idea of the loss of inertia produced by the dimension reduction.
for (int iv = 0; iv < 2; iv++)
{
double itotal = 0;
for (int ic = GetColPosition(ColumnPosition.FirstDataColumn); ic < GetColPosition(ColumnPosition.Mass); ic++)
{
double rtmp = 0;
for (int ir = 0; ir < _data.Rows.Count - 7; ir++)
{
rtmp += (double)_data.Rows[ir][ic] * (double)_data.Rows[ir][iv + GetColPosition(ColumnPosition.Dim1RowStandard)];
}
itotal += rtmp * (double)_data.Rows[iv + GetRowPosition(RowPosition.Dim1ColStandard)][ic];
}
_data.Rows[GetRowPosition(RowPosition.Inertia)][iv + GetColPosition(ColumnPosition.Dim1RowStandard)] = Math.Round(itotal * itotal, _precision);
_data.Rows[iv + GetRowPosition(RowPosition.Dim1ColStandard)][GetColPosition(ColumnPosition.Inertia)] = Math.Round(itotal * itotal, _precision);
}
When all the calculations are made, the program shows a new tab where you can see the graphic of the correspendence analysis, like in this image:
You can use the toolbar buttons to show the data using principal coordinates for columns, rows or for both, in the symmetric version.
With the Mass button you can show the points with a size proportional to their mass.
With the SetGraphScales, the graph boundaries are selected from the helper variables, depending of the selected option.
private void SetGraphScales()
{
if (bSymm.Checked)
{
_sizeX = new SizeF(Math.Min(_rowDimP1.Width, _colDimP1.Width), Math.Max(_rowDimP1.Height, _colDimP1.Height));
_sizeY = new SizeF(Math.Min(_rowDimP2.Width, _colDimP2.Width), Math.Max(_rowDimP2.Height, _colDimP2.Height));
}
else if (bRow.Checked)
{
_sizeX = new SizeF(Math.Min(_rowDimP1.Width, _colDimS1.Width), Math.Max(_rowDimP1.Height, _colDimS1.Height));
_sizeY = new SizeF(Math.Min(_rowDimP2.Width, _colDimS2.Width), Math.Max(_rowDimP2.Height, _colDimS2.Height));
}
else
{
_sizeX = new SizeF(Math.Min(_rowDimS1.Width, _colDimP1.Width), Math.Max(_rowDimS1.Height, _colDimP1.Height));
_sizeY = new SizeF(Math.Min(_rowDimS2.Width, _colDimP2.Width), Math.Max(_rowDimS2.Height, _colDimP2.Height));
}
}
There are also helper functions to get the row and column coordinates and mass in function of the current settings.
private float RowCoordinate(int dim, int row)
{
if (bRow.Checked || bSymm.Checked)
{
return dim == 0 ? Convert.ToSingle(_data.Rows[row][GetColPosition(ColumnPosition.Dim1RowPrincipal)]) : Convert.ToSingle(_data.Rows[row][GetColPosition(ColumnPosition.Dim2RowPrincipal)]);
}
else
{
return dim == 0 ? Convert.ToSingle(_data.Rows[row][GetColPosition(ColumnPosition.Dim1RowStandard)]) : Convert.ToSingle(_data.Rows[row][GetColPosition(ColumnPosition.Dim2RowStandard)]);
}
}
private float ColCoordinate(int dim, int col)
{
if (bCol.Checked || bSymm.Checked)
{
return dim == 0 ? Convert.ToSingle(_data.Rows[GetRowPosition(RowPosition.Dim1ColPrincipal)][col]) : Convert.ToSingle(_data.Rows[GetRowPosition(RowPosition.Dim2ColPrincipal)][col]);
}
else
{
return dim == 0 ? Convert.ToSingle(_data.Rows[GetRowPosition(RowPosition.Dim1ColStandard)][col]) : Convert.ToSingle(_data.Rows[GetRowPosition(RowPosition.Dim2ColStandard)][col]);
}
}
private float RowMass(int row, float max)
{
return max * (bMass.Checked ? _cMinScale + (Convert.ToSingle(_data.Rows[row][GetColPosition(ColumnPosition.Mass)]) - _minRMass) * _rMassSc : 1f);
}
private float ColMass(int col, float max)
{
return max * (bMass.Checked ? _cMinScale + (Convert.ToSingle(_data.Rows[GetRowPosition(RowPosition.Mass)][col]) - _minCMass) * _cMassSc : 1f);
}
The code for painting the graph is in the Paint event of the panel in the Graph tab. It is not tricky and I think that is self explanatory. Is only an example that can be improved to include it in your own graphic library.
And this is all that the sample project contains. I have written it using the 2013 version of Visual Studio and the 4.5 version of the Framework, but I think that can be generated using any other version.
Thanks for reading and I hope you find useful this code.
I'm working with computers since the 80's of the past century, when I received as a present a 48K Spectrum which changed all my life plans, from a scientific career to a technical one. I started working in assembler language, in low lewel systems, mainly in the electromedical field. Today I work as a freelance, mainly in .NET Framework / database solutions, using the C# language.
I'm interested in scientific computer applications, and I,m learning AI and data analytics technics. I also own a technical blog, http://software-tecnico-libre.es/en/stl-index, where I publish some of the practice works of this learning process.


