Contents
Introduction
The Visual StudioTM built-in debugger is a well known debugger, that offers both managed and mixed debugging options but when we need to debug memory related issues such optimizing application performance, solving program crashes or out of memory exceptions, then we really need a more powerful debugger that can give detailed insight into the objects on the heap and garbage collection (GC).
There are also a number of profiling tools available on the market to analyze hangs or crashes like .NET memory profiler and Ants profiler, which seem to be the most common. These tools might fail and become useless in situations where application is not in a good enough shape to be profiled.
What Do I Mean by a Bad Shaped Application?
Suppose an application has so many objects containing self-references that the value of ".NET CLR Memory->% Time spent in GC" is as high as 80% while it is running normally without being profiled. The application would probably crash and cause the profiler tool itself to hang. I faced a similar situation while trying to analyze the cause of an out of memory (OOM) exception in a WinForms application a few days back. As a result, I chose to use WinDBG + SOS as my .NET profiler. Why??? This question will be answered before we reach the end of this article.
Why WinDBG + SOS?
At first glance, WinDBG + SOS seemed to be the right choice because
- It is freely available from Microsoft. :)
- It provides treatment to cancer patients even at their last stage; I mean it helps diagnosing a bad shaped application with ease.
- It is a perfect blend that allows Native and Managed debugging at the same time.
I had heard of WinDBG quite a few times but never used it until my application would not launch using my normal profiling tools while trying to diagnose an OOM exception. I found much stuff scattered all over the internet about using WinDBG but it was difficult to put all the pieces together and understand how to actually debug an application using this tool. So as a result, I thought it would be useful to document all the details in one place to make things simpler for others who have decided to start using WinDBG and are not familiar with its usage and potential.
Things to Understand Before Using WinDBG and SOS
What is WinDBG?
WinDBG is a multipurpose debugger for Microsoft Windows, distributed on the web by Microsoft. It can be used to debug user mode applications as well as kernel applications such as drivers and even the operating system. We will only deal with debugging user mode applications in this article.
See this figure to have a quick look at WinDBG.
What Can WinDBG Do?
- WinDBG is used to debug crash dumps or mini dumps. Dumps are generated when an application crashes/hangs or memory is used up and used for postmortem debugging. The Debugging Essentials section explains dumps in more detail.
- WinDBG can also be used for debugging live targets, usually on the developer's own machine.
- WinDBG debug engine is part of the windows operating system; it supports debugging native code but its extensions allow managed debugging as well.
- WinDBG is very extensible, as it supports loading external libraries for debugging the Common Language Runtime. In this article we will be working with
SOS.dll. - WinDBG supports sharing the debug session on a remote machine, which means two people can analyze an issue at the same time by sharing a debug session.
What is SOS.dll (Son of Strike)?
SOS is an NTSD, short for NT System Debugger (a low-level debugger)contained in an extension DLL that enables managed code debugging when used with WinDBG for native debugging. The SOS extension DLL can also be used directly from within the Visual Studio IDE and allows seeing what is happening inside the GC and the heap.
Note: SOSEx is an upgrade of SOS. Read about it in the Points of Interest section.
Debugging Essentials
Following are the terms we need to understand before delving into the initial debugging steps using WinDBG:
- Debug Symbols
- Program Database
- Managed vs. Native Debugging
- First and Second Chance Exceptions
- Crash dumps vs. Mini dumps
- Crash vs. Hang dump (mini-dump)
- Kernel Mode vs. User Mode Debug Symbols
Debug symbols help the debugger to map raw addresses in the executable to source-code lines. These symbols are nothing but .pdb files each stored in a separate directory and can be downloaded from the Microsoft web site at http://msdl.microsoft.com/download/symbols[^]
See this figure for information on how to set up debug symbols in Visual Studio.
MSDN indicates that you must have symbol information when you debug applications with the various Microsoft tools. Symbol files provide a footprint of the functions that are contained in the executable files and dynamic-link libraries. Additionally, symbol files can present a roadmap of the function calls that lead to the point of failure. For example, you must have the symbols when you dump call stacks inside a debugger.
Program Database
Program database files with extension .pdb are stored in a file separate from the executable. A program database (PDB) file holds debugging and project state information that allows incremental linking of a Debug configuration of your program. They are really required when you do not have source code on the debugging machine.
How debugger finds pdbs?
Let's consider the Visual Studio debugger first, as most of us use it frequently. It uses the project PDB file created by the linker directly and embeds the absolute path to the PDB in the EXE or DLL file. If the debugger cannot find the PDB file at that location or if the path is invalid (for example, if the project was moved to another computer), the debugger searches the path containing the EXE, the Symbol Path specified in the solution's Property Pages (Common Properties folder, Debug Symbol Files page). See this figure for information on how to set debug symbols in Visual Studio.
WinDBG searches for the required PDBs at the path defined for the symbol server which is 'Symbol File Path'. See also this figure.
Managed vs. Native Debugging
Let’s suppose that we have a C# or VB project that uses unmanaged COM objects. Considering the Visual Studio debugger again, if we want to debug only the C# or VB code that we've written, that is managed debugging. Howver, at some point we might want to debug into the COM object. That would be native debugging.
We would first need to enable native debugging following the steps below
- Right click on the project in the Solution Explorer
- Go to properties -> "Configuration Properties | Debugging | Enable Unmanaged Code" and check to enable.
Figure 1: Enabling Unmanaged Debugging in Visual Studio
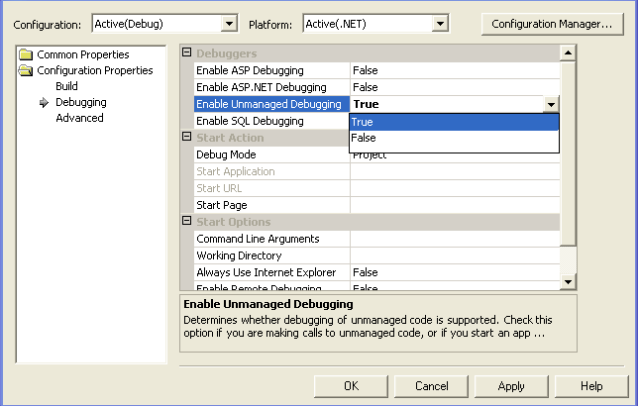
You can now debug both managed and native code, which is actually mixed debugging.
Notes: WinDBG is an advanced level native code debugger and when used with SOS, also supports debugging managed code.
First and Second Chance Exceptions
A debugger gets notified of each exception twice. It is notified the first time before the application gets a chance to handle the exception ('first chance exception'). If the application does not handle the exception, the debugger is then given a chance to handle the exception ('second-chance exception'). If the debugger does not handle a second-chance exception, the application quits.
Crash Dumps vs. Mini Dumps
There are two ways to use the debugger; either attach it to a running process or use it to analyze a crash dump. The first option allows you to look into what is going on in your application while it is running but is only feasible while debugging in the development environment not the production environment (here we need memory dump). There are crucial differences between the two environments, but I won't discuss the differences here as it is beyond the scope of this article. So, dumps provide an option to separate the actual debugging phase from the data collection process.
Crash Dumps
The first generation of crash dumps, often called "full user dumps", included every byte of the entire process space, so a crash in a simple application like Text Editor would be several megabytes in size. While undoubtedly useful for post-mortem debugging, such dumps often became so huge that it was impossible, or at least inconvenient, to transfer them to the software developers electronically. These are no longer used.
Minidumps
Minidumps are highly customizable. While generating a mini dump, instead of saving the entire process space, only certain sections are saved. But if needed, a mini dump can contain even more information than an old style crash dump. For example, mini dumps can contain information about kernel objects used by the process.
The customizable nature of mini dumps allow choosing what information about the application’s state we need to debug effectively while keeping the mini dumps as small as possible. Minidumps are to be taken using external tools; we’ll be using adplus.vbs script, that is part of the WinDBG installation. We’ll see how to take a customized dump in the Capturing Dumps section.
Writing a mini dump without using an external tool:
The redistributable DbgHelp.dll exposes a public API for creating mini dumps programmatically and we do not have to rely on external tools anymore. This can be really helpful in a sensitive production environment where some customer might not want to install tools to take dumps. Writing a mini dump with MiniDumpWriteDump() is explained nicely in an article by Andy Pennell
Crash vs. Hang Dump (mini-dump)
A crash dump is needed when we can't determine when the problem will happen. It will typically happen due to a program crash like the name implies, but that's not the only case. In this case we can configure the debugger in advance to monitor our target process and capture a dump when the process is terminated, or when we need to capture a dump on a specific exception. We’ll be seeing capturing dumps in later section Capturing Dumps.
A hang dump can be captured after the problem has occurred but the process is still in memory, for example in a memory leak scenario, but also when a process is burning the CPU.
Notes: From here onward, when I say dump, I mean to say mini dump as we'll be working with mini dumps throughout the remain of this discussion.
Launch WinDBG
First please install Debugging Tools for Windows from WinDbg Installation
After installation you should find WinDBG.exe in the installation folder and launch the executable.
Figure 2: A Quick Look at WinDBG Options

Set the Symbol Path to the Microsoft Symbol Server with WinDBG by following these steps:
- Start the Windows Debugger.
- On the File menu, click Symbol File Path (Ctrl+S).
- In the Symbol Path box, type the following
SRV*your local folder for symbols*http:
where your local folder for symbols is the folder in which you copy your local symbol cache. The debug symbols are downloaded to this location.
Figure 3: Set Symbol Path
Set the Source Path as follows:
- Start the Windows Debugger.
- On the File menu, click Source File Path (Ctrl+P).
- In the Source Search Path box, type the following
C:\SourceDir\
Where, SourceDir contains source files of the target application to be debugged.
Figure 4: Set Source Path
Following is a cheat sheet that explains most of the commands you will need to start with:
You can download the "cheat sheet" from Kent Boogaart's blog. The download is available in various formats.
SOS help: Typing !SOS.help in the WinDBG command window will also list all the SOS commands.
The following is a categorized list of SOS commands, borrowed from Johan Straarup's blog. Functions are listed by category, then roughly in order of importance. Shortcut names for popular functions are listed in parenthesis.
Object Inspection
-----------------------------
DumpObj (do)
DumpArray (da)
DumpStackObjects (dso)
DumpHeap
DumpVC
GCRoot
ObjSize
FinalizeQueue
PrintException (pe)
TraverseHeap | Examining CLR data structures
-----------------------------
DumpDomain
EEHeap
Name2EE
SyncBlk
DumpMT
DumpClass
DumpMD
Token2EE
EEVersion
DumpModule
ThreadPool
DumpAssembly
DumpMethodSig
DumpRuntimeTypes
DumpSig
RCWCleanupList
DumpIL |
Examining code and stacks
----------------------------
Threads
CLRStack
IP2MD
U
DumpStack
EEStack
GCInfo
EHInfo
COMState
BPMD | Diagnostic Utilities
-----------------------------
VerifyHeap
DumpLog
FindAppDomain
SaveModule
GCHandles
GCHandleLeaks
VMMap
VMStat
ProcInfo
StopOnException (soe)
MinidumpMode |
Help on Specific Command
If you need help on a specific command you can use !< SOS >.help <commandname>, for example:
0:000> !sos.help dumpobj
Another useful command is:
!DumpObj [-v] [-short] [-r 2] <object address>
This command allows you to examine the fields of an object, as well as learn important properties of the object such as the EEClass, the MethodTable, and the size.
Notes: The entire list of WinDBG command can also be found here.
Executing Batch Commands
There are two ways to execute the above commands as a batch
- Enter all the commands in the debugger window as a single string, all separated by a semicolon.
- Store all the commands in a script file and run them using the following command:
$$>< (Script file)
CPU Registers
While analyzing the stack and heap we would see the following register names:
- EAX - Generic 32 bit (8 byte) register
- EBX - Generic 32 bit (8 byte) register
- ECX - Generic 32 bit (8 byte) register
- EDX - Generic 32 bit (8 byte) register
- EDI - Extended Destination Pointer
- EBP - Extended Base Pointer
- ESI - Extended Source Index
- ESP - Stack Pointer
- EIP - Current CPU address (Instruction pointer)
Capturing Dumps
Dumps can be taken using Adplus Script, adplus.vbs, a part of the WinDBG installation. Adplus Script allows taking customized dumps with various configurable options. The following link explains step by step how to capture customized dumps.
Notes:
Usually it works to take dump just after the exception has occurred, unless the process exits shortly after the exception. In that case, start WinDBG and run the application directly from WinDBG. It will load the .exe and immediately break. Type g (go) and press enter.
When the process terminates, WinDBG will automatically break again. You can then save a dump using the .dump command:
.dump /ma <output file>
Debugging with WinDBG and SOS
Debugging Live Targets
This type of debugging is usually done on development machines where the application source code is also available.
- I. Using WinDBG
- Start WinDBG
- Run the application directly from WinDBG using File | Open Executable (Ctrl+E)
Or
Attach to a running process using File | Attach to a Process (F6)
Using the "Non Invasive" option in the dialog showing process list, would allow you to detach from the debugged process without killing it (if you’re on Windows XP or 2003) but limits the commands that you can use, so leave it unchecked.
Figure 5: Attach to Running Executable
- WinDBG will load the executable and immediately break the execution.
- Type
.load SOS in the command window to load the SOS extension and enable managed code debugging.
Figure 6: Load SOS Extension
- Setup breakpoint on a function issuing the following command
!bpmd TestApp.exe TestClass.MyMethod
if required to break program execution at some specific point. - Type
g (go command) and press enter to switch to debugee (target application), so that you can work on it. - WinDBG will automatically break again, when either the process has terminated exceptionally or it hits the breakpoint. You can then investigate the process and also save a dump using the
.dump command for postmortem debugging.
Notes:
- When the debugee is running you can always get back to the debugger by issuing a CTRL+BREAK to the WinDBG window. It will try and halt the debugee for you and drop you back to the command prompt; some people call it immediate window.
- More Examples: These examples should be enough to get comfortable with the commands to analyze the problems.
- II. Without Using WinDBG [Using SOS from visual studio]
SOS can also be used directly from within VS2003 and updated versions of Visual Studio without WinDBG. Follow these steps to work with SOS:
- Open the target visual studio project in debug mode, let’s call it debugee.
- Enable native debugging. In order to load any extension like SOS.dll you have to be debugging in native mode, so before starting the debugger, go into Project | Properties | Debug on the context menu for the project and check the box to Enable unmanaged code debugging.
- Set Symbol Server Path.
- Press
F5 to start debugging - Load SOS Extension
See the output window, it will show all the loaded symbols. After Visual Studio stops loading the symbols, load SOS by typing the following command in the immediate window ( Alt+Ctl+I )
.load C:\WINDOWS\Microsoft.NET\Framework\vx.x.xxxx\SOS
Where vx.x.xxxx is the version of the .NET framework used by debugee
Or
.loadby SOS mscorwks
- Analyze heap using SOS commands. A small tutorial to use SOS from within Visual Studio 2005 is at the following URL: http://mtaulty.com/CommunityServer/blogs/mike_taultys_blog/archive/2006/10/25/8930.aspx
- III. Using Both WinDBG and Visual Studio Debugger at once
The following link shows how one can easily use Visual Studio and the power of WinDBG together. http://www.wintellect.com/cs/blogs/jrobbins/archive/2007/12/08/use-two-debuggers-at-once.aspx
Debugging Dump Files (Postmortem Debugging)
- I. Using WinDBG
- Open dump file using WinDBG File | Open Crash Dump (Ctrl+D) menu.
- Load SOS by typing in the command window
.load SOS or
.load C:\WINDOWS\Microsoft.NET\Framework\v1.1.4322\SOS - 3. Analyze the dump. An example is at http://blogs.msdn.com/johan/archive/2007/01/11/i-am-getting-outofmemoryexceptions-how-can-i-troubleshoot-this.aspx
- II. Without Using WinDBG [Using SOS from visual studio]
It is interesting that VS 2003 actually does support postmortem debugging of managed applications as well as using SOS. However, it supports only managed mini dumps, unlike VS upgraded versions, which support both managed and native dumps.
- Open the .dmp file in Visual Studio using File | Open | Project
- Press F5 to start debugging
- Load SOS. Once you've clicked through the prompts and symbols have been loaded (you can see all the symbols loaded in output window), open the immediate window and type
.load SOS
Once the extension loads successfully you can type !help to list all the SOS command
- Analyze the state of your managed application that is captured in the dump
Examples
See the following links for more examples.
- Troubleshooting OutOfMemoryExceptions
- Debugging .NET Hang
- Debugging .NET Memory Leak Part I: Define the “Where?”
- Debugging .NET Memory Leak Part II: A Case Study
Points of Interest
- This blogcontains the following useful readings:
- I. How to automate WinDBG startup; just by selecting a menu option available on .dmp file right click
- II. How to connect to a remote debug session
- SOSEx is an upgrade of SOS. It is more powerful and easier to use, also solves some of the common limitations while using SOS. You can see SOSEx commands in action here.
- Dumping on a terminal session
If you need to dump a process on a Windows NT or Windows 2000 machine, you cannot do so through a Terminal Server session, since the debugger cannot attach to a process which runs in a different Window Station, and if you try you'll likely get a message like Win32 error 5 Access is denied.
This is by design but there are a couple of solutions if you need them, check You cannot debug through a Terminal Server session or look at the "Running in crash mode remotely" topic in Windbg help.
DebugDiag makes it easier to overcome this limitation. Simply configur it to run in service mode through its property dialog. Read more here.
History
- February 12, 2008 - Initial Version
This member has not yet provided a Biography. Assume it's interesting and varied, and probably something to do with programming.


 General
  News
News  Suggestion
  Question
  Bug
Bug  Answer
  Joke
Joke  Praise
  Rant
Rant  Admin
Admin 


