Introduction
I have found one of most difficult things about thread programming
is debugging, because you must constantly keep track of which thread is active,
and what thread is supposed to be doing. While I was looking in MSDN for something
else, I came across an article by John Robbins. Toward very end of article,
Robbins shows how to store descriptive text in Thread Information Block (TIB)
(which Matt Pietrek has described), and then how to display this
information in VC debugger using a watch expression.
IMPORTANT NOTE: I am not claiming
authorship for idea of using TIB to store thread description. Please see
citations listed below for original articles by Pietrek and Robbins. I have merely
repackaged TIB routines into handy header file, and would like
to bring this to attention of others here at CodeProject, because I believe this
technique is so obscure that few may be aware of it.
Thread Information Block
Matt Pietrek documented fields of TIB in his May 1996 article in MSJ.
There is TIB for each thread running in Win32 system, and
in all Intel-based Win32 implementations, FS register points to TIB.
This leads to following function to obtain TIB address of active thread:
static tagXTIB * GetTIB()
{
	tagXTIB * pTib;

	__asm
	{
		MOV  EAX , FS:[18h]
		MOV  pTib , EAX
	}
	return pTib;
}
Among TIB structure fields that are common to all Win32 implementations, there is one at 14H called
pvArbitrary, which is available for applications to use however they want. This is field
that XTib will use to store pointer to descriptive string.
How To Use
First thing to do is to include header file XTib.h. Next, call SetThreadName()
from thread function, with string that will uniquely identify thread. This string
can be generated from thread function's lpParameter (thread function argument) - for example,
lpParameter could be some integer value, or pointer to some string. Final step is
to set watch expression in debugger. To do this, set breakpoint (for example, somewhere
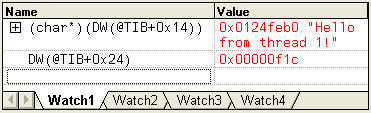
in thread function). When debugger breaks, enter this expression in watch window:
(char*)(DW(@TIB+0x14))
Now debugger will automatically display string pointed to by pvArbitrary field in TIB.
This saves you from having to go to Debug | Threads to find out what thread you are in.
For applications running under NT, another useful watch expression is
DW(@tib+0x24)
This will display the thread ID, which is stored at 24H in the TIB on NT 4, Win2000, and XP.
XTib Demo
Demo project provides sample app that creates five threads and lets
you see what is displayed in watch window.
Here is what watch window will display for thread 1:
Acknowledgments
XTib code is based on:
-
"Under The Hood", May 1996 Microsoft Systems Journal, by Matt Pietrek.
-
"Bugslayer", January 2000 Microsoft Systems Journal, by John Robbins.
Usage
This software is released into the public domain.
You are free to use it in any way you like.
If you modify it or extend it, please to consider
posting new code here for everyone to share.
This software is provided "as is" with no expressed
or implied warranty. I accept no
liability for any damage or loss of business that this
software may cause.


 General
  News
News  Suggestion
  Question
  Bug
Bug  Answer
  Joke
Joke  Praise
  Rant
Rant  Admin
Admin 


![Rose | [Rose]](https://codeproject.global.ssl.fastly.net/script/Forums/Images/rose.gif)

