The Problem We Solve
Agile BI is not a term many would associate with MSRS Reports and SharePoint Dashboards. While many organizations first turn to the Microsoft BI stack because of its familiarity, stitching together Microsoft's patchwork of SharePoint, SQL Server, SSAS, MSRS, and Office creates administrative headaches and requires considerable time spent integrating and writing custom code.
This Showcase outlines the ease of accomplishing three of the most fundamental BI tasks with LogiXML technology as compared to MSRS and SharePoint:
- Building a dashboard with multiple data sources
- Creating interactive reports that reduce the load on IT by providing users self-service
- Integrating disparate data sources
Read below to learn how an agile BI methodology can make your life much easier when it comes to
dashboards and reports. Don't feel like reading? Click
here to see us build a BI app with 3 data sources in under 10 minutes.
Building a Dashboard with LogiXML vs. MSRS + SharePoint
Microsoft's only solution for dashboards is to either write your own code from scratch, manipulate SharePoint to serve a purpose for which it wasn't initially designed, or look to third party apps. Below are some of the limitations to Microsoft's approach to dashboards:
- Limited Pre-Built Elements: Microsoft components come with only limited libraries of pre-built elements. In addition to actual development work, you will need to come up with an idea of how everything will work together. This necessitates becoming familiar with best practices in dashboards and reporting.
- Sophisticated Development Expertise Required: While Microsoft components provide basic capabilities, anything more sophisticated is development resource-intensive and requires you to take on design, execution, and delivery. Any complex report visualizations and logic, such as interactive filters, must be written in code by the developer.
- Limited Charts and Visualizations: Microsoft has a smaller sub-set of charts and visualization tools. If you want access to the complete library of .NET-capable charts, you'll still need to OEM another charting solution at additional expense.
- Lack of Integrated Workflow: Microsoft does not include workflow features sets out of the box in their BI offering.
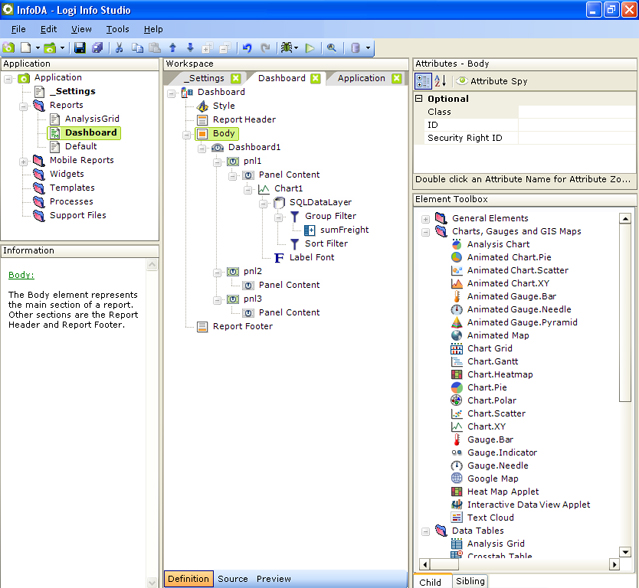
LogiXML technology is centered on Logi Studio: an elemental, agile BI design environment which lets you simply choose from hundreds of powerful and configurable pre-built elements. Logi's pre-built elements equip developers with tools to speed development, as well as the processes and logic required to build and manage BI projects. Below is a screen shot of the Logi Studio while building new dashboards.
Start a free LogiXML trial now.
Logi developers can easily create static or user-customizable dashboards using the Dashboard element. A dashboard is a collection of panels containing Logi reports, which in turn contain table, charts, images, etc. At runtime, the user can customize the dashboard by rearranging these panels on the browser page, by showing or hiding them, and even by changing their contents using adjustable reporting criteria.
The data displayed within the panels can be configured, as in any Logi report, to link to other reports, providing drill-down functionality.

The dashboard displayed above has tabs and user customization enabled.
The Dashboard element provides customization features, such as drag-and-drop panel positioning, support for built-in parameters the user can access to adjust the panel's data contents, and a panel selection list that determines which panels will be displayed. AJAX techniques are utilized for web server interactions, allowing selective updates of portions of the dashboard. Dashboard customizations can be saved on an individual-user basis to create a highly personalized view of the data.
The Dashboard Wizard
The 'Create a Dashboard' wizard assists developers in creating dashboards by populating the report definition with the necessary dashboard-related elements.
You can easily point to any data source by selecting from a variety of DataLayer types, including SQL, StoredProcedures, Web Services, Files, and more. A simple to use drag and drop SQL Query builder is also integrated, to offer a guided approach to constructing queries when connecting to your database.
Using the Dashboard Element
The Dashboard element is used to create the top level structure for all of your interactive panels within the final output. Under your dashboards, you can optionally add any number of Dashboard Panels, Panel Parameters for dynamic filtering, and even automatic refresh features with AJAX-based refresh timers.
Changing Appearance Using Themes and Style Sheets
The appearance of a dashboard can be changed easily by assigning a theme to your report. In addition, or as an alternative, you can change dashboard appearance using style.
The Dashboard element has its own Cascading Style Sheet (CSS) file containing predefined classes that affect the display colors, font sizes, button labels, and spacing seen when the dashboard is displayed. You can override these classes by adding classes with the same name to your own style sheet file.
See us build a BI app with 3 data sources in under 10 minutes.
Ad Hoc Reporting Creation with LogiXML: Analysis Grid
The Analysis Grid is a managed reporting feature giving end users virtual ad hoc capability. It is an easy to use tool that allows business users to analyze and manipulate data and outputs in multiple and powerful ways.
Start a free LogiXML trial now.
Create an Analysis Grid by using the "Create Analysis Grid" wizard, or by simply adding the AnalysisGrid element into your definition file. Like the dashboard, data for the Analysis Grid can be accessed from any of the data options, including SQL databases, web sources, or files. You also have the option to launch the interactive query builder wizard for easy, drag-drop, SQL query creation.
The Analysis Grid is composed of three main parts: the data grid itself, i.e. a table of data to be analyzed; various action buttons at the top, allowing the user to perform actions such as create new columns with custom calculations, sort columns, add charts, and perform aggregations; and the ability to export the grid to Excel, CSV, or PDF format.
The Analysis Grid makes it easy to perform what-if analyses through features like filtering. The Grid also makes data-presentation impactful through visualization features including data driven color formatting, inline gauges, and custom formula creation.
Ad Hoc Reporting Creation with Microsoft
While simple ad hoc capabilities, such as enabling the selection of parameters like date ranges, can be accomplished quickly and easily with Microsoft, more sophisticated ad hoc analysis is challenging due to the following shortcomings.
Platform Integration Problems
Microsoft BI strategy is not unified and is strongly tied to SQL Server. To obtain analysis capabilities, you must build cubes through to the Analysis Service, which is a separate product with its own different security architecture. Next, you will need to build reports that talk to SQL server, also using separate products.
Dashboards require a SharePoint portal which is, again, a separate product with separate requirements and licensing. If you don't use this, you must completely code your dashboards from scratch. Unfortunately, Microsoft Reporting Services doesn't play well with Analysis Services or SharePoint since these were built on different technologies.
SharePoint itself offers an out of the box portal and dashboard solution but unfortunately with a number of significant shortcomings. SharePoint was designed as a document management and collaboration tool as opposed to an interactive BI dashboard solution. Therefore, in order to have a dashboard solution optimized for BI, reporting, and interactivity you are faced with two options:
- Build it yourself using .NET and a combination of third party components
- Buy a separate third party product
Many IT professionals find these to be rather unappealing options, since they require evaluating a new product or components, and/or a lot of work to build and make sure it integrates with the rest of the Microsoft stack.
Additionally, while SQL Server and other products support different types of security architectures, Analysis Services only has support for using integrated Windows NT security models to access cubes and therefore creates integration challenges.
Moreover, for client/ad hoc tools, you need Report Writer, a desktop product, or Excel - another desktop application. In addition to requiring separate licenses, these products don't even talk to one another in the same ways, as they were built by different companies and subsequently acquired by Microsoft.
Each product requires a separate and often disconnected development environment with different design and administration features. Therefore to manage Microsoft BI, you must have all of these development environments available and know how to use them all.
Integration of Various Data Sources: LogiXML vs. Microsoft
LogiXML is data neutral, allowing you to easily connect to all of your organization's data spread across multiple applications and databases. You can connect with any data source or data model and even combine data sources such as current data accessed through a web service with past data in spreadsheets.
Integration of Various Data Sources with Microsoft
Working with Microsoft components for BI means you will be faced with the challenge of limited support for non-Microsoft based databases and outside data sources. The Microsoft BI stack is centered on SQL Server databases and therefore the data source is optimized to work with SQL Server. Unfortunately, if you need outside content it can be very difficult to integrate.
Finally, Microsoft BI tools are designed with the total Microsoft experience in mind and are therefore optimized for Internet Explorer. While other browsers and devices might be useable, the experience isn't optimized and may potentially lack in features or visualize differently.
Start a free LogiXML trial now.
This member has not yet provided a Biography. Assume it's interesting and varied, and probably something to do with programming.


 General
  News
News  Suggestion
  Question
  Bug
Bug  Answer
  Joke
Joke  Praise
  Rant
Rant  Admin
Admin 


