HBarChart is a simple C# control. It helps you develop your own charts quickly and print them easily.
Contents
HBarChart is a simple C# control. It helps you develop your own charts quickly and print them easily.
A while ago, I created an MFC bar chart control and shared it here on The Code Project. In a discussion below that article, I promised to create a C# version of the same control, and here it is. The only problem is that probably the code looks more like C++ than C#. I hope you'll forgive me; this is one of the few C# codes I've ever written.
Enjoy, and please help me with invaluable notes, bugs reports, ideas, etc. that you think might will improve the quality of this code.
To use this control, first we have to add it to a project. You can use one of the following two methods to add it.
Add a Reference to the Project
- Copy the BarChart folder, available inside the CPBarChart source folder attached to this article, and all its contents into your solution folder.
- Right click on the Solution Explorer of Visual Studio, and select: Add Existing Project, and select the BarChart folder.
- Select the project you want to add the chart to and right click on it in the Solution Explorer.
- Select Add Reference, select the Project tab of the dialog that opens, and select
BarChart, then recompile the solution. - In the Visual Studio toolbox window, you should be able to see a new group named
[YouProjectName] Components, inside which the HBarChart item is visible. - Drag the
HBarChart component onto any Windows Forms control.
Add the DLL
- In the Visual Studio toolbox, right click at the top of a category (like General) and select Choose Items.
- In the .NET Framework Components tab, find the Browse button, and using the Browse window, select BarChart.dll.
- Now, drag the new bar chart control that's added to the toolbox, on to a form.
You can alternatively drag the DLL to the Visual Studio toolbox.
The background of the chart could be either linear/radial gradient or solid. Gradient uses two colors to draw background of the chart.
To set the background mode, use Background.PaintingMode. It's of type enum, and could be set to either SolidColor, LinearGradient or RadialGradient.
The chart background also has to define the color. The color depends on the current mode selected. If a gradient is selected, there are two colors to be set: GradientColor1 and GradientColor2. If a solid color is your choice of the background, then SolidColor should be identified. The background default mode is radial gradient, and the default colors are: Argb(255, 140, 210, 245) and Argb(255, 0, 30, 90) and could be modified in the CBackgroundProperty() constructor. To change mode or color in your code, use Background property of the chart:
barChart.Background.PaintingMode = CBackgroundProperty.PaintingMode.LinearGradient;
barChart.Background.GradientColor1 = Color.Aqua;
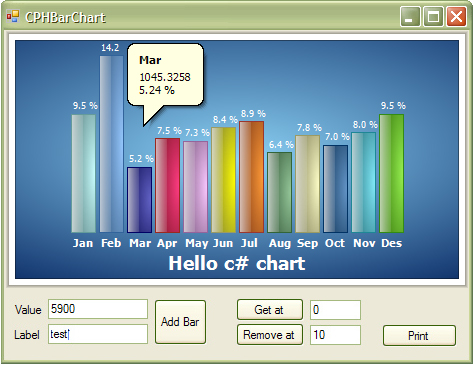
The description is the bottom-most descriptive line of text. In the snapshot, it is: "Hello C# Chart." Its usage is to describe what the chart shows. You can modify its Text, Color, Font, and Visibility.
barChart.Description.Font = fontDialog.Font;
barChart.Description.Text = "Annual coffee usage of c# team.";
barChart.Description.Color = Color.White;
barChart.Description.Visible = true;
To make the chart more flexible, I made it possible to modify the labels at the bottom of each bar and also the value text at the top of each bar. Please note that while it's possible to modify the labels and the values, they can only be modified as a whole, and it's not possible to do it for each bar separately.
barChart.Label.Font = fontDialog.Font;
barChart.Label.Color = Color.White;
barChart.Label.Visible = true;

barChart.Values.Font = fontDialog.Font;
barChart.Values.Color = Color.White;
barChart.Values.Visible = true;
Instead of the value of each bar, it's also possible to use a percentage. In my MFC version of this chart which was created for a particular purpose, I needed to show the percentage of each value compared to the maximum value. It was considering the maximum value to have 100%. In this chart that is created solely for CodeProject members, I take a more useful, and probably more popular, approach, and the percentage of the value compared to the total values is used, i.e., only a lonely bar will have 100%, and by adding a second bar, each percentage shows the share of the total value the bar takes. Two bars with same values, in this case, each will have 50% of the total value.
barChart.Values.Mode = CValueProperty.ValueMode.Percent;
HBarchart can display a solid border around the chart. Its size and color can be customized.
barChart.Border.Color = colorDialog.Color;
barChart.Border.Width = 5;
Two types of shadows can be displayed around the chart; Inner and Outer. Inner shadow starts from inner rims of the bounding rectangle of the chart and moves towards center of the chart, and outer shadow starts from outer sides of the bounding rectangle and move outside. You can set the chart to draw any of them, both of them or none of them.
barChart.Shadow.Mode = CShadowProperty.Modes.Inner;
You can also set size of the shadow:
barChart.Shadow.WidthInner = 2;
And finally color of the shadow:
barChart.Shadow.ColorInner = Color.Black;
Please note that transparency (alpha) of the color of the shadow is important to have a stronger (darker) shadow or a lighter one.
The last customization of the chart is about sizing. The chart has two sizing modes. The Normal mode has no limitation to any drawing. For example, you can change fonts so that parts of texts are out of the chart control, that makes them invisible. The Normal sizing mode along with fonts, colors, texts, BarSize and BarGapSize (white space between bars) makes it possible to create a fully customized chart.
The other possible mode is AutoScale, in which case, the control decides the sizes. It simply tries to fit the chart in its bounding rectangle. Your desired colors and fonts will be used, but the size of the fonts and bars are calculated automatically.
barChart.SizingMode = HBarChart.BarSizingMode.AutoScale;
After customizing the chart to your will, it's time to use it, by adding new values, retrieving, or removing them.
To add a new value to the chart, use the Add method as follows:
barChart.Add(
1600.356,
"Jan",
Color.Aqua);
Note that the control uses this color (the last parameter of Add) to create a gradient for the bar, which in my humble opinion is more polished. The gradient's darker color is 100 units darker, so to get best results, please use colors with their (R, G, B) all over 100. E.g., Color.FromArgb(255, 150, 160, 255).
You can alternatively use Items property directly. It's an IList collection.
barChart.Items.Add( new HBarItem(
1600.356,
"Jan",
Color.Aqua));
You can use RemoveAt to remove bars from the control for a specific zero based index.
barChart.RemoveAt(0);
Or again use Items collection.
barChart.Items.RemoveAt(0);
Call ModifyAt to change value of a bar.
barChart.ModifyAt(0, 6250);
or change values directly.
barChart.Items[0].Value = 6250.1148;
Call InsertAt or Items.Insert to insert a bar at a specified zero based index.
barChart.InsertAt(
3,
2650.8265,
NewLabel,
Color.Red);
To get a value or any other information about each bar, you can call the GetAt method. The method has two definitions: one that returns a double value corresponding to a bar when its 0 based index is given; the other overloaded function returns an HBarItem object. HBarItem is a class that holds all data about a bar, including its value, color, label, the bounding rectangle inside the chart and many more.
HBarItem bar;
if (barChart.GetAt(0, out bar))
{
double dValue = bar.Value;
}
Other than normal set of events for a user control, there are four other events supported by HBarChart: BarClicked, BarDoubleClicked, BarMouseEnter and BarMouseLeave. To handle these events, you can follow one of these two methods:
In Visual Designer
Right click on the chart control on your form and select Properties. At the top of the properties window, select Events button. Then head to Bar Chart section, you should see them. Double click on the title of any event you want to handle.

Handle Events Manually
It's a two step job; first register for the event:
barChart.BarClicked += new BarChart.HBarChart.OnBarEvent(this.On_BarChart_BarClicked);
Second, add an event handler function:
private void On_BarChart_BarClicked(object sender, BarChart.BarEventArgs e)
{
    MessageBox.Show(String.Format("bar #{0} Clicked!", e.BarIndex);
}
Use the Print method to print the chart.
barChart.Print(true, "PrintDocumentName");
Print receives two arguments. The first one indicates whether the chart should be fitted to paper or should be printed with the same scale of the display. It acts similar to the sizing mode of the chart. The second parameter is the name of the print document. In my to do list, printing is marked as incomplete. There's a class in the BarChart namespace named CPrinter that, together with the Print method of the HBarChart class, is responsible for printing. If you need better printing support, you can modify them.
Chart now has a minimal supports for Datasource. It can be connected to a data source. It reads data and responds to changes, but at the moment it's a one way connection and modified chart data will not be mirrored to the datasource. You can look at it as a read only DataSource support.
How chart uses DataSource
At the moment, when you set chart datasource, it expects you to provide a combination of rows and columns that each row displays a chart. For each column, there will be a bar that takes its value from the row. Demo application of this article has a DataGridView control on the form that shows how exactly chart works with data.
Extending Chart DataSource Capabilities
I designed the DataSource in a way that makes it possible to create your own way of reading data and displaying them. HBarChart has a data connection class that connects to datasource and retrieves rows and columns of data automatically. To display these rows and columns in chart, it uses a class that implements IDataConnectionEvents. If you want to be able to interpret rows and columns of data your way, just create a class that implements the interface:
public class CreateChartMyWay : IDataConnectionEvents
Then tell the chart to use your class:
this.barChart.DataSourceManager.DataEventHandler = new CreateChartMyWay();
Doing this, chart will work with data and calls functions that you implemented in your class when needed. It calls functions that are defined in the interface. By implementing IDataConnectionEvents, your class will have these functions:
void DataSource_ItemUpdated(int nRowIndex, int nColIndex);
void DataSource_ItemDeleted(int nItemIndex);
void DataSource_ItemAdded(int nItemIndex);
void DataSource_SelectedRowChanged(int nPosition);
void DataSource_ResetItems();
void DataSource_DataBoundCompleted();

void SetData(object chart, object dataConnection);
Functions starting by DataSource_ will be called when a change occurs in the underlying data.
DataSource_ItemUpdated | Will be sent after connection class receives ListChangedType.ItemChanged and indicates a change in a row. |
DataSource_ItemDeleted | Will be sent after connection class receives ListChangedType.ItemDeleted and indicates a row deleted. |
DataSource_ItemAdded | Will be sent after connection class receives ListChangedType.ItemAdded indicating a new row added. |
DataSource_ResetItems | Will be sent after connection class receives any of the following ListChangedTypes: Reset(Many roes changed), ItemMoved(some row indexes changed), PropertyDescriptorAdded(change in schema probably a new column), PropertyDescriptorDeleted(change in schema probably a column removed), PropertyDescriptorChanged(change in schema, a column changed). |
DataSource_SelectedRowChanged | Will be sent after connection class receives PositionChanged event. It means a new row is Current row of the DataSource. |
DataSource_DataBoundCompleted | It is called when a connection established to DataSource and rows and columns are populated with DataSource data. |
Please note that when DataSource_ItemDeleted is called, data is not actually deleted from rows and columns of connection class, so that you can find data that is to be deleted easily. After the call however, it will be removed.
A final important note: The SetData function is called after your class is instantiated and will give you a reference to both chart (of type HBarChart) and the connection (of type CDataConnection) classes. Chart reference can be used to interact with bars or other chart GUI related stuff and connection to work with rows and columns.
- 2008/06/20
- 2008/06/24
- 2008/07/09
- Support for negative numbers
- Support for DataSource
- Items converted to an
IList collection - Added bar drawing type (subject to change)
- Added border for the chart
- Added Shadows for the chart
- Added Radial Gradient background mode
- A lot of performance tweaks
This member has not yet provided a Biography. Assume it's interesting and varied, and probably something to do with programming.


 General
  News
News  Suggestion
  Question
  Bug
Bug  Answer
  Joke
Joke  Praise
  Rant
Rant  Admin
Admin 


