Introduction
This is an article which explains how to create a user control which is generic in terms of functionality by considering a Line Graph Control. The Line Graph User control is the group of controls which includes panels, labels, Grids and so on. The control can be added to your tool box and can be dragged and dropped on to the winform. It contains all the features of a graph and can be just used like a component.
Background
Any UI functionality we create should not be specific to the system that utilizes it. Always think in terms of its reusability as UI implementations require a lot of effort. For example, if you need to plot a graph on a winform, then most of us just implement the graph functionality on the form. Instead, think like implementing the functionality which can be reusable. To reuse the functionality, create a user control which can be reused by any system with minimal efforts. Creation of user control requires much of background work. It's just like collecting the requirements before we dive in to the actual implementation. Think in terms of the end user who uses the control and you get all the requirements to be met by the control.
Planning a Graph Control
Developing any graph component requires the following design options:
- X Axis (Supporting x axis values, Label for the indication)
- Y Axis (Supporting y axis values which includes different scaling features like logarithmic, linear so on. Label for the indication)
- Plotting Area (Supporting Grids which includes scaling of Horizontal and Vertical grids)
- Note: All the options related to Color (like grid color, Plot line color, background color) have to be taken care. The options to change the colors as and when required should be provided.
Using the Code
The Technical aspect in the implementation of the control is explained taking the design options as above into consideration.
Implementation of Y Axis
The Y axis contains the minimum and maximum range for the points that is to be plotted. The selection of minimum and maximum range depends on the application that utilizes it. There are two types of scaling that are supported by the graph as below:
- Linear Graph: This graph consists of the range which has fixed value of increment. Here the increment factor is added to the previous values.
Example: Increment Factor=2, Min =2 ,Values=2,4,6,8,10,12 and so on. - Logarithmic Graph: Here the increment factor is multiplied with the previous value.
Example: Increment Factor=4, Min =1, Values=1,4,16,64,256,1024 and so on.
private void mpanelYAxisPaint(object sender, PaintEventArgs e)
{
try
{
Graphics g = e.Graphics;
pnlYAxis.BackColor = Color.FromName(YAxisBackColor.Name);
int l = 0;
float k = LogarithmicMin;
int plen = 0;
int temp = plotArea.Height / NoOfYGrids;
Font mfYAxisFont = new Font("Arial", 7f, FontStyle.Regular);
for (int i = 0; i <= NoOfYGrids; i++)
{
if (!IsLogarithmic)
{
using (Pen p = new Pen(Color.Black))
{
g.DrawString(l.ToString().PadLeft(l.ToString().Length),
mfYAxisFont, Brushes.Black,
new PointF(4f, this.plotArea.Height +
panelYExtra.Height - plen-7));
}
plen = plen + temp;
l = l + YGridInterval;
}
else
{
using (Pen p = new Pen(Color.Black))
{
g.DrawString(k.ToString().PadLeft(k.ToString().Length),
mfYAxisFont, Brushes.Black,
new PointF(0f, this.plotArea.Height +
panelYExtra.Height - plen-7));
}
plen = plen + temp;
k = k * LogarithmicIncFactor;
}
}
mfYAxisFont.Dispose();
}
catch (Exception ex)
{
}
}
...
The drawing of the strings on y axis is implemented using the graphics object of y axis panel. Find the x value and the y value where the string has to be drawn.
Implementation of X Axis
The x axis contains the values for which the points are plotted against y. There are many technical aspects to be considered while drawing the strings on the X axis as below:
- Synchronization of the values to be moved with the plotting of the graph
- The interval between the two values displayed on the axis
- The values have to be updated accordingly when the scroll bar event occurs
The code below shows the handling of graphics objects and the values accordingly updated when any event occurs.
private void mpanelXaxisPaint(object sender, PaintEventArgs e)
{
try
{
int temp = 0;
Graphics g = e.Graphics;
pnlXAxis.BackColor = Color.FromName(XAxisBackColor.Name);
g.SmoothingMode = System.Drawing.Drawing2D.SmoothingMode.AntiAlias;
int j = 0;
if (!scrollBar.Visible)
temp = Convert.ToInt32(totalPointTime) * GridSpacingX;
else
temp = Convert.ToInt32(totalPointTime) * GridSpacingX -
(((this.scrollBar.Maximum - this.scrollBar.LargeChange) -
noOfMoves) * GridSpacingX);
if (j < 0) return;
for (int i = (this.pnlXAxis.Width - temp - this.panelExtra.Width);
i <= this.pnlXAxis.Width && j >= 0; i += GridSpacingX, j++)
{
if (j >= this.values.timeCount)
return;
if (Convert.ToInt32(this.values.GetTIMEIndex(j, "Time"))
% XValueDisplayInterval == 0)
{
g.DrawString(this.values.GetTIMEIndex(j, "Time"),
new Font("Arial", 8f, FontStyle.Regular), Brushes.Black,
new PointF(i-3, this.pnlXAxis.Height / 12));
}
}
}
catch (Exception ex)
{
}
}
The number of moves in the scroll bar event is considered to update the values accordingly.
Implementation of Plot Area
The plot area consists of Grids and the values which are plotted against x and y. Before locating the points on the plot area Grids (Horizontal and Vertical) have to be drawn. The drawing of Horizontal and Vertical Grids with the required scale is user configurable. The number of Horizontal lines is determined by NoOfYGrids property and the interval between the Vertical lines is determined by the GridSpacingX property. The implementation is as shown below:

Here we divide the plot area with the NoOfYGrids, so that we get the Height of each Grid where a horizontal line can be plotted. To calculate the Vertical lines, we start plotting the lines from right corner and go on incrementing by the GridSpacingX value and is stopped while the incrementing value reaches beyond the plot area.
private void PaintGrid(Graphics g)
{
try
{
g.SmoothingMode = System.Drawing.Drawing2D.SmoothingMode.AntiAlias;
using (Pen p = new Pen(Color.FromName(XGridColor.Name)))
{
for (int i = this.plotArea.Width - gridScrollOffset;
i >= 0; i -= GridSpacingX)
{
g.DrawLine(p, i, 0, i, this.plotArea.Height);
}
}
using (Pen p = new Pen(Color.FromName(YGridColor.Name)))
{
for (int i = this.plotArea.Height; i >= 0; i -= GridSpacingY)
{
g.DrawLine(p, 0, i, this.plotArea.Width, i);
}
}
}
catch (Exception ex)
{
}
}
Next comes the interesting aspect that is plotting the point on the plot area. The point is placed on the plot area with respect to X and Y value. These X and Y values are with respect to pixels. The code below explains the methodology used in the determination of points:
void PaintGraph(Graphics g)
{
try
{
g.SmoothingMode = System.Drawing.Drawing2D.SmoothingMode.HighQuality;
#region general
float dx = this.DX;
float x = this.plotArea.Width;
int t = this.values.timeValCount;
int i = this.values.PointCount;
int pointtracker = 0;
#region Point
if (this.values.PointCount == 0)
return;
if (--t <= 0)
return;
float distance = this.plotArea.Width;
if(!this.scrollBar.Visible)
distance -= Convert.ToInt32(totalPointTime) * GridSpacingX;
else
distance -= Convert.ToInt32(totalPointTime) * GridSpacingX -
(((this.scrollBar.Maximum - this.scrollBar.LargeChange) -
noOfMoves) * GridSpacingX);
if (!this.scrollBar.Visible)
x -= Convert.ToInt32(totalPointTime) * GridSpacingX;
else
x -= Convert.ToInt32(totalPointTime) * GridSpacingX -
(((this.scrollBar.Maximum - this.scrollBar.LargeChange) -
noOfMoves) * GridSpacingX);
p.X=x;
p.Y=ScaleY(this.values.GetIndex(0, "Point"));
if (NoOfGraphs == 2)
{
p1.X=x;
p1.Y = ScaleY(this.values.GetIndex2(0, "Point")) ;
}
pointtracker = 1;
for (; ; )
{
if (pointtracker == i || i <= 0)
break;
ScaleX((Convert.ToInt64(this.values.GetTIMEIndex
(pointtracker, "PointTime"))), ref x);
q.X=x;
q.Y=ScaleY(this.values.GetIndex(pointtracker, "Point"));
using (Pen pen = new Pen
(Color.FromName(PlotLine1Color.Name), PlotLine1Width))
{
g.DrawLine(pen, p, q);
}
p = q;
if (NoOfGraphs == 2)
{
q1.X=x;
q1.Y=ScaleY(this.values.GetIndex2(pointtracker, "Point"));
using (Pen pen = new Pen(Color.FromName(PlotLine2Color.Name),
PlotLine2Width))
{
g.DrawLine(pen, p1, q1);
}
p1 = q1;
}
pointtracker++;
}
#endregion
#endregion
}
catch (Exception ex)
{
}
}
In the process of plotting the points on the plot area, there are two points to be calculated dynamically as shown below:
- X Axis point: The X axis contains the time in milliseconds. So each grid represents a second in the graph. Each grid is divided in such a way that the second should exactly point to the grid in terms of x value. For example:
Sample Collected = 1100 ms
Each Grid = 1 sec(1000 ms)
Division of Each Grid= 10 parts(100ms*10)=1000ms
So 1100 falls on the point as shown below:
The code for the explained calculation is as given below:
private void ScaleX(float source, ref float x)
{
try
{
double tempsource = Math.Ceiling(source);
float temp = (float)this.GridSpacingX / 10;
double d = tempsource / 100;
double ans = d * temp;
ans = Math.Round(ans, 2);
x += (float)ans;
}
catch (Exception ex)
{
}
}
- Y Axis point: The Y axis point contains the actual calculated point dynamically. The Y point represents the pixel(point) within the plot area.The calculation of the points with respect to linear and logarithmic is as shown in the code below:
float ScaleY(float y)
{
try
{
float eachgrid = this.plotArea.Height / NoOfYGrids;
float extraspace = this.plotArea.Height - (eachgrid * NoOfYGrids);
if (!IsLogarithmic)
{
int h = this.plotArea.Height - 2;
float t = h - ((y - 0) / ((NoOfYGrids * YGridInterval) - Min)) * h;
if (t < 0)
t = 1;
return t + extraspace;
}
else
{
if (y == 0)
return this.plotArea.Height;
double ans = y;
double min = LogarithmicMin;
double max = LogarithmicMax;
if (ans <= min)
return this.plotArea.Height - extraspace - 1;
float t = (float)((this.plotArea.Height-extraspace) *
((Math.Log10(ans) - Math.Log10(min)) /
(Math.Log10(max) - Math.Log10(min))));
float ypoint = t;
if (ypoint < 0)
ypoint = 0;
if (ypoint > (this.plotArea.Height - extraspace))
ypoint = (this.plotArea.Height - extraspace);
return (this.plotArea.Height - ypoint);
}
}
catch (Exception ex)
{
}
return 0f;
}
Properties supported by the Line Graph Component
The actual logic behind the plotting of the Graph is that whenever a point is added to buffer, the plotArea is invalidated which causes the plotarea to paint again. So in the process of painting, all the points from the buffer are painted including the recent points that are added to the buffer which produces the view of running graph. The points that are to be plotted on the plotArea are added using the Add() method that is being exposed by the component as shown below:
lineGraph1.Add(graph1point,graph2point,time(in milliseconds));
Each time, the point added using the method as shown above redraws the graph which leads the user to experience the graph as runtime graph. If the user wants to clear the points form the buffer, then the method as shown below can be used.
lineGraph1.Clear();
This method clears all the points placed in the buffer and leaves the graph in the state as it was first launched.
Features Supported by Line Graph
- Supports Cross thread reference (i.e., the graph can be updated from any thread)
- Supports any number of points just by incrementing the
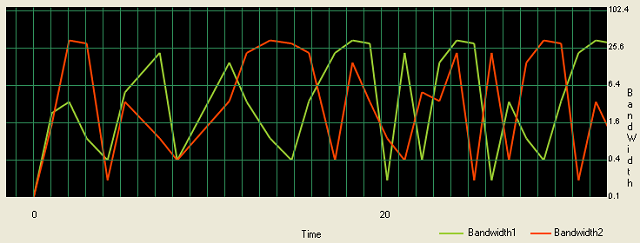
Buffersize value - Supports 2 graphs to be plotted simultaneously
- Supports user configurable layout and colors
- Supports two scaling options (Linear and Logarithmic)
- Accurate placing of points in terms of X and Y axis
- Supports design time preview for all the properties
- Supports buffer functionality i.e., a scroll bar appears to see the previous values
- Scrolling the scroll bar towards left pauses the plotting of the graph but points are collected in to buffer in the back end. Double Click on the graph resumes the plotting with all the collected points.
Points of Interest
Developing a user control enriches the coding capability in terms reusability, logical ideas, meeting end user requirements and so on. After developing the line graph component, any solution to be provided I started thinking in terms of reusability. It was great fun and a challenging task developing the component as it includes many features. Each feature was very interesting to me as it requires some amount of designing as well as implementation methodology. Supporting design time preview was very interesting. I obtained a lot of information regarding GDI+ stuff as well as UI designing in the process of development. Interested people can just start with a small control which will be very useful to them in most of the scenarios. During the process of development you gain hands on many conceptual information. Next version of this component will be in WPF.
Note: The values used for the plotting of the graph in the demo are just hardcoded values taken from an array. If you use the control in your solution, you can add the points using Add() method from the realtime scenario calculated or obtained.
History
- 27th October, 2011: Initial version
Indian.
He is a software developer. He loves programming. Always willing to work on new technologies.
His only passion is "Updating on technologies"
Want to know more about me?
Visit http://www.sandeepsunku.com


 General
  News
News  Suggestion
  Question
  Bug
Bug  Answer
  Joke
Joke  Praise
  Rant
Rant  Admin
Admin 


