Introduction
I'm a student of Game Development at Full Sail University in Florida. I created this profiler to determine which functions have a severe impact on performance in my games. I could then try to optimize those functions.
This profiler is a combination of a slightly modified version of CConsole classes written by Greeeg and a heavily modified version of the CProfiler classe written by Hernán Di Pietro. Visit their project pages for more information.
Class Modifications
CConsole
The only modification done to the CConsole class was in the function Output(char* szString). I modified it so that it takes a string instead of a char*. The functionality of the function is identical. The fact that I only made one simple modification is proof that Greeegs class was extremely well built and flexible.
CProfiler
The original CProfiler class had very basic profiling functionality, it stored the current time (accurate to the microsecond) when the ProfileStart function is called, and it would measure the time again once the ProfileEnd function was called. The time that the function took to execute was the difference between the start time and end time.
I took the basic concept of Hernáns's class and expanded on it by adding a console output, the ability to profile multiple functions, the ability to profile a function multiple times and taking the average time it took to execute, etc.
The first step towards making these features possible was to create a profiled function structure. This structure stores the name of a function, the location of that function within the program, any notes the user might want to add, and other members that pertain to time measurment. Then I made the CProfiler class hold a vector of these profiled functions, that way I can output the results of the profiling tests to a LOG file. Having a vector of profiled functions also allowed me to identify which function is being profiled, so the user can have functions being profiled within other profiled functions. The major modifications were made within the definitions for the ProfileStart and ProfileEnd functions, where I create new profile functions, update them, and log them to the console or OutputDebug from VS.
Original ProfileStart:
void CProfiler::ProfileStart(LOGTYPE logtype)
{
m_Retval = QueryPerformanceCounter (&m_StartCounter);
m_LogType = logtype;
}
Updated ProfileStart:
void CProfiler::ProfileStart(string funcName, string funcLocation, string notes,
bool profileMultipleTimes, int numTotalProfileTimesBeforeLog) {
if(!profileMultipleTimes)
{
int nID = -1;
for(int i = (int)m_vProfiledFunctions.size() - 1; i >= 0; --i)
{
if(m_vProfiledFunctions[i].funcName == funcName &&
m_vProfiledFunctions[i].funcLocation == funcLocation)
nID = i;
}
if(nID == -1)
{
FUNCTION_PROFILE function;
function.funcName = funcName;
function.funcLocation = funcLocation;
function.notes = notes;
function.numTimesCalled = 1;
function.elapsedTimes.push_back(0);
m_Retval = QueryPerformanceCounter (&function.StartCounter);
m_vProfiledFunctions.push_back(function);
}
else
{
m_vProfiledFunctions[nID].numTimesCalled += 1;
m_vProfiledFunctions[nID].elapsedTimes.push_back(0);
m_Retval = QueryPerformanceCounter (
&m_vProfiledFunctions[nID].StartCounter);
}
}
else
{
int index = -1;
for(int i = (int)(m_vProfiledFunctions.size() - 1); i >= 0; --i)
{
if(m_vProfiledFunctions[i].funcName == funcName &&
m_vProfiledFunctions[i].funcLocation == funcLocation)
{
index = i;
break;
}
}
if(index != -1)
{
if(m_vProfiledFunctions[index].numTimesCalled <
m_vProfiledFunctions[index].numTotalProfileTimes + 1)
m_vProfiledFunctions[index].numTimesCalled += 1;
m_vProfiledFunctions[index].multipleCalls = true;
m_Retval = QueryPerformanceCounter (
&m_vProfiledFunctions[index].StartCounter);
}
else
{
FUNCTION_PROFILE function;
function.funcName = funcName;
function.funcLocation = funcLocation;
function.notes = notes;
function.numTimesCalled = 1;
function.multipleCalls = true;
function.numTotalProfileTimes = numTotalProfileTimesBeforeLog;
m_Retval = QueryPerformanceCounter (&function.StartCounter);
function.elapsedTimes.push_back(0);
m_vProfiledFunctions.push_back(function);
}
}
}
I know this function is a bit messy and could be made simpler, but the basic functionality is there and it gets the job done. (Besides I only started programming C++ 8 months ago... Gimme a break)
The ProfileEnd function also went through a major overhaul, because now it's outputting the results to a console, or OutputDebug (VS). Check out the CProfiler.cpp from my example if you want to see exactly what's going on.
The last change was the inclusion of the Shutdown function. This function basically iterates through the vector of profiled functions and saves all the results to a text LOG file, if the user so specifies in the LOGTYPE parameter in the Initialize function. I will explain all the functions and how to use them in detail in the following sections.
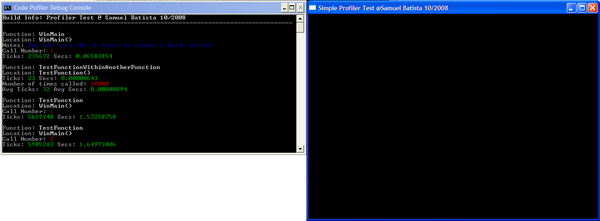
Overview
The CProfiler class calculates the amount of time a function takes to execute. The class is a singleton, so you can have access to it anywhere in your program. The profiler has a debug console window to display the results of the profiled functions. It can also output the results to the OutputDebug window in Visual Studio. But, most importantly, it saves the results of all the profiled functions to a LOG text file, so you can evaluate the results after the program has finished. The profiler is very simple and easy to use, but it's also powerful. You can profile functions within functions; so, for example, if you want to know how long a program takes to initialize, you profile the Initialize function, but within that function, you can profile individual function calls to know exactly what inside the Initialize function takes the longest to execute. The last interesting feature is that you can profile functions multiple times (within a loop, for example), and you can specify how many times you want the profiler to profile that function. After it has profiled the function the specified amount of times, it'll display the time the last call took to execute, as well as the average time the function took to execute.
The CProfiler Class
The CProfiler class consists of three main parts: the console class, a profiled function structure, and the actual profiler class.
The CConsole Class
The CConsole class is nearly identical to the class Greeeg wrote; the only difference is that I use strings to output messages while he uses char pointers. Please see his project page if you need assistance with his class.
The FUNCTION_PROFILE Structure
struct FUNCTION_PROFILE
{
    string           funcName;
    string           funcLocation;
    string           notes;
    UINT             numTimesCalled;
    UINT             numTotalProfileTimes;
    LARGE_INTEGER    StartCounter;
    bool             multipleCalls;

    vector<__int64>  elapsedTimes;
    __int64 	     totalElapsedTime;

    FUNCTION_PROFILE()
    {
        funcName = "";
        funcLocation = "";
        notes = "";
        numTimesCalled = 0;
        multipleCalls = false;
        numTotalProfileTimes = 1;
        totalElapsedTime = 0;
        ZeroMemory(&StartCounter,sizeof(StartCounter));
    }
};
The first few members are pretty self explanatory, the name of the function being profiled, the location of said function, any notes you might want to add (optional), number of times called, and number of times you want to profile the function (this is only valid if the bool multipleCalls is set to true).
The vector<_int64> elapsedTimes is the collection of time (in ticks) of the function. We need a vector here because if a function is profiled more than once, you want to know the time that each call took to execute.
And finally, the totalElapsedTime is incremented by the elapsed time every time the function is called; again, this is only valid if the bool multipleCalls is set to true. This variable is used to calculate the average time a multiple profiled function took to execute.
The CProfiler Class
The CProfiler class declaration is as follows:
class CProfiler
{
public:
static CProfiler* GetInstance(void);
CConsole* GetConsole() { return &console; }
void Initialize(string buildInfo, LOGTYPE logtype =
LOG_DEBUG_OUTPUT);
void Shutdown();
void ProfileStart(string funcName, string funcLocation,
string notes = "", bool profileMultipleTimes = false,
int numTotalProfileTimesBeforeLog = 1000);
void ProfileEnd (string funcName, string funcLocation);
void LogResults (int nID);
double SecsFromTicks ( __int64 ticks);
private:
CProfiler(void);
~CProfiler(void);
CProfiler(const CProfiler &ref);
CProfiler &operator=(const CProfiler &ref);
CConsole console;
string m_sBuildInfo;
LARGE_INTEGER m_QPFrequency; LARGE_INTEGER m_EndCounter; DWORD m_Retval; LOGTYPE m_LogType;
bool m_bLogMultipleNow;
vector<FUNCTION_PROFILE> m_vProfiledFunctions;
};
The first time the GetInstance() function is called, it will create the only instance of the class that will be used throughout the program; after that, it returns a pointer to the instance of the class.
GetConsole() returns a pointer to the console class, so you can use it to add text to the debug console. For example:
CProfiler* profiler = CProfiler::GetInstance();
profiler->GetConsole()->Output("Debug Information");
profiler->GetConsole()->Output();
One thing to note is that calling profiler->GetConsole()->Output(); will make a newline.
I will cover how to use the Initialize, ProfileStart, ProfileEnd, and Shutdown functions in the Using the Code section.
The LogResults function will log the results of the profiled function to either the Console or DebugOutput (from VS), depending on the LOGTYPE specified in the Initialize function.
Using the Code
The first thing you must do anywhere you want to profile your code is to get the instance to the class. Being a singleton class, you can't have CProfiler objects, so you have to create a pointer to the class. The class creates itself, so you don't have to worry about creating it.
CProfiler* profiler = CProfiler::GetInstance();
Then, at the beginning of your program, you need to initialize the profiler by calling the Initialize function.
profiler->Initialize("Test Build", LOGALL);
The two parameters the function takes are a string BuildInfo and LOGTYPE.
The BuildInfo is a string that will be displayed on top of the console window before any functions are profiled. It will also appear on the top of the LOG file.
The LOGTYPE is an enumeration with logging options. You can chose one of the following:
LOG_DEBUG_OUTPUT - Logs the results to the VS Debug Output window only.LOGCONSOLE - Logs the results to the console only.LOGTEXTOUT - Logs the results to a text LOG file only.LOGALL - Logs the results to the console and a text LOG file.
After the profiler is initialized, you can then start profiling functions by calling ProfileStart and ProfileEnd. For example:
CProfiler* profiler = CProfiler::GetInstance();

profiler->ProfileStart("TestFunction", "WinMain()",
    "See how long the test function takes to execute.");

TestFunction();

profiler->ProfileEnd("TestFunction", "WinMain()");
To profile functions multiple times (within a loop, for example) is very similar:
while(true)
{

    profiler->ProfileStart("Update", "WinMain()",
        "See how long the test function takes to execute.", true, 10000);

    Update();

    profiler->ProfileEnd("Update", "WinMain()");

}
After the function is profiled 10000 times, the profiler will calculate the average time it took to execute, and it'll output the result.
Conclusion
Geez... Making an article on CodeProject takes a long time... Thank goodness, it's over :)
I would like to personally thank Hernán Di Pietro and Greeeg for sharing their awesome programs. Without their knowledge, I would have never been able to do this. I would also lose points in my class, because having a code profiler for our game is a required feature. Thanks guys!
Feel free to use, modify, and expand this profiler. It's free to use even in commercial applications. Just please make sure to mention myself and the other authors somewhere in your application. Also, please leave a comment or suggestion, I like to get feedback from the programming community. Happy coding everyone!
This member has not yet provided a Biography. Assume it's interesting and varied, and probably something to do with programming.


 General
  News
News  Suggestion
  Question
  Bug
Bug  Answer
  Joke
Joke  Praise
  Rant
Rant  Admin
Admin 


