Introduction
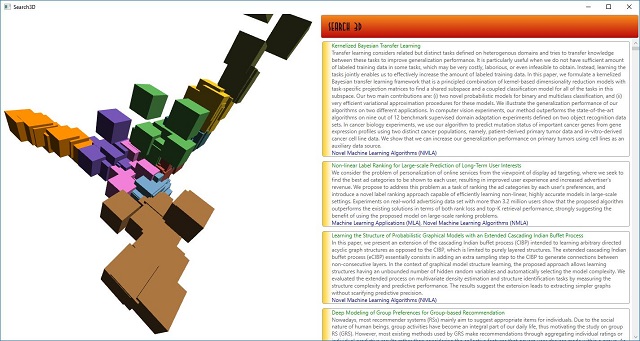
The 3D capabilities of WPF are used here to visualise a document collection, in this case the list of accepted papers to AAAI 2014 (an artificial intelligence conference).
Latent Semantic Analysis (LSA) uses the Singular Value Decomposition (SVD) of a document/term matrix to project the document collection into a three dimensional latent space. This space is then visualised in a 3D scene that can be navigated by dragging the mouse.
The application uses the open source Bright Wire machine learning library to create and normalise the term document matrix, and its associated linear algebra library to perform the SVD and LSA.
Background
Please see my previous CodeProject article for a brief introduction to vector space model techniques. The main takeaway is that they revolve around the count of each term per document, which are normalized and then stored in a matrix. The columns or rows that represent the documents can then be compared for similarity using vector multiplication.
One way SVD has been described is as follows: Suppose you have thousands of tropical fish swimming around in a large fish tank. You want to take a photograph of a fish that shows the full variety of fish in the tank, while preserving the relative distance between fishes. SVD will be able to tell you, at any given moment, the best place and angle to position the camera to take that "optimum" photo.
Building the Visualisation
When the application starts it:
- Downloads the accepted papers dataset
- Parses the CSV into a
DataTable - Creates strongly typed
AAAIDocuments from the DataTable - Uses each document's meta data to create sparse feature vectors
- Normalises the sparse feature vectors and creates dense feature vectors
var uri = new Uri("https://archive.ics.uci.edu/ml/machine-learning-databases/00307/%5bUCI%5d%20AAAI-14%20Accepted%20Papers%20-%20Papers.csv");
var KEYWORD_SPLIT = " \n".ToCharArray();
var TOPIC_SPLIT = "\n".ToCharArray();
var docList = new List<AAAIDocument>();
using (var client = new WebClient()) {
var data = client.DownloadData(uri);
Dispatcher.Invoke(() => {
_statusMessage.Add("Building data table...");
});
var dataTable = new StreamReader(new MemoryStream(data)).ParseCSV(',');
dataTable.ForEach(row => docList.Add(new AAAIDocument {
Abstract = row.GetField<string>(5),
Keyword = row.GetField<string>(3).Split(KEYWORD_SPLIT, StringSplitOptions.RemoveEmptyEntries).Select(str => str.ToLower()).ToArray(),
Topic = row.GetField<string>(4).Split(TOPIC_SPLIT, StringSplitOptions.RemoveEmptyEntries),
Group = row.GetField<string>(2).Split(TOPIC_SPLIT, StringSplitOptions.RemoveEmptyEntries),
Title = row.GetField<string>(0)
}));
}
var docTable = docList.ToDictionary(d => d.Title, d => d);
var stringTable = new StringTableBuilder();
var classificationSet = new SparseVectorClassificationSet {
Classification = docList.Select(d => d.AsClassification(stringTable)).ToArray()
};
var encodings = classificationSet.Vectorise(true);
Next, these dense feature vectors are combined into a document/term matrix and its SVD computed.
The top three singular values and the corresponding rows of the VT matrix and then multiplied to create the latent space into which the document/term matrix has been projected.
K-means clustering is run on the latent space to find groups of similar documents, and colours associated with each cluster.
var matrix = lap.CreateMatrix(vectorList.Select(d => d.Data).ToList());
const int K = 3;
var kIndices = Enumerable.Range(0, K).ToList();
var matrixT = matrix.Transpose();
var svd = matrixT.Svd();
var s = lap.CreateDiagonal(svd.S.AsIndexable().Values.Take(K).ToList());
var v2 = svd.VT.GetNewMatrixFromRows(kIndices);
using (var sv2 = s.Multiply(v2)) {
var vectorList2 = sv2.AsIndexable().Columns.ToList();
var lookupTable2 = vectorList2.Select((v, i) => Tuple.Create(v, vectorList[i])).ToDictionary(d => (IVector)d.Item1, d => lookupTable[d.Item2]);
var clusters = vectorList2.KMeans(COLOUR_LIST.Length);
var clusterTable = clusters
.Select((l, i) => Tuple.Create(l, i))
.SelectMany(d => d.Item1.Select(v => Tuple.Create(v, d.Item2)))
.ToDictionary(d => d.Item1, d => COLOUR_LIST[d.Item2])
;
Then Document models are created with their associated AAAIDocuments, 3D projection and the cluster colours. The document locations are then normalised for the visualisation.
var documentList = new List<Document>();
int index = 0;
double maxX = double.MinValue, minX = double.MaxValue, maxY = double.MinValue, minY = double.MaxValue, maxZ = double.MinValue, minZ = double.MaxValue;
foreach (var item in vectorList2) {
    float x = item[0];
    float y = item[1];
    float z = item[2];
    documentList.Add(new Document(x, y, z, index++, lookupTable2[item], clusterTable[item]));
    if (x > maxX)
        maxX = x;
    if (x < minX)
        minX = x;
    if (y > maxY)
        maxY = y;
    if (y < minY)
        minY = y;
    if (z > maxZ)
        maxZ = z;
    if (z < minZ)
        minZ = z;
}
double rangeX = maxX - minX;
double rangeY = maxY - minY;
double rangeZ = maxZ - minZ;
foreach (var document in documentList)
    document.Normalise(minX, rangeX, minY, rangeY, minZ, rangeZ);
Finally, each Document is converted into a Cube and added to the 3D viewport.
var numDocs = documentList.Count;
_cube = new Cube[numDocs];

var SCALE = 10;
for(var i = 0; i < numDocs;  i++) {
    var document = documentList[i];
    var cube = _cube[i] = new Cube(SCALE * document.X, SCALE * document.Y, SCALE * document.Z, i);
    cube.Colour = document.Colour;
    viewPort.Children.Add(cube);
Working with the 3D model
The 3D scene contains a directional light to give the cubes some extra depth, along with a PerspectiveCamera - the positions of which are both transformed by the trackball code in response to mouse input.
We can hit-test the 3D cubes with the following code:
Cube foundCube = null;
SearchResult correspondingSearchResult = null;
HitTestResult result =
   VisualTreeHelper.HitTest(viewPort, e.GetPosition(viewPort));
RayHitTestResult rayResult = result as RayHitTestResult;
if(rayResult != null) {
    RayMeshGeometry3DHitTestResult rayMeshResult =
            rayResult as RayMeshGeometry3DHitTestResult;
    if(rayMeshResult != null) {
        GeometryModel3D model =
              rayMeshResult.ModelHit as GeometryModel3D;
        foreach(KeyValuePair<int,> item in _cubeLookup) {
            if(item.Value.Content == model &&
                      _searchResultLookup.TryGetValue(item.Key,
                      out correspondingSearchResult)) {
                foundCube = item.Value;
                break;
            }
        }
    }
}
Then, the brushes on the selected/deselected cube and the corresponding search result can be updated accordingly.
The 3D scene can be positioned by holding down the left or right mouse buttons and dragging the mouse. The interesting thing about this trackball code is that the mouse events are fired on a transparent border that is superimposed over the 3D scene. This is because WPF's Viewport3D class doesn't fire mouse events unless the cursor is over a 3D model. The trackball code is basically a "black box" that can be attached to any 3D scene to implement visual manipulation of the scene. We attach it as follows (note that we are attaching to the super-imposed border):
ModelViewer.Trackball trackball = new ModelViewer.Trackball();
myPerspectiveCamera.Transform = trackball.Transform;
directionalLight.Transform = trackball.Transform;
...
trackball.EventSource = borderCapture;
Conclusion
LSA is widely used technique to reduce the dimensionality of a dataset. In this case, by projecting it into three dimensions instead of the more typical two dimensions for visualisation we are preserving more information that we can actually use.
Using this visualisation we can see that the documents generally follow a fairly consistent pattern, with three main peaks of documents representing Game Theory, Humans and AI and Planning and Execution and with a large core of papers that describe concrete machine learning techniques forming the majority of the document collection.
A visualisation like this also makes it easy to spot the outliers in the dataset.
The major downside to this technique is that the SVD is expensive to compute. You might see an improvement if you run Bright Wire on the GPU, but generally LSA is not practical for very large matrices.
History
- May 19, 2009: First version.
- February 23, 2017: Major revision with an updated URL for the dataset.


 General
  News
News  Suggestion
  Question
  Bug
Bug  Answer
  Joke
Joke  Praise
  Rant
Rant  Admin
Admin 


