Contents
There are as many different ways to stay organized as there are people. It is not a trivial task. Many disciplines, schools of thought, and solutions are devised to increase efficiency and, possibly, decrease complexity. As a matter of fact, the most popular article on Code Project[^] is ToDoList 5.8.4 - A simple but effective way to keep on top of your tasks[^]... However, while it is essential that we plan, track and report on our daily tasks, there is no standard way to do it. People have to adapt to a new system (and comply to its requirements) every time they switch their working environment. This article suggests the use of spreadsheets to record tasks as a universal, minimalistic, portable, flexible, and very customizable approach that requires "no" learning curve.
The attached workbook can be used as a template for measuring daily tasks. It has no macros and can be used in Microsoft Excel [^] and OpenOffice [^]. It has been successfully tested with older and newer versions of these applications.
| Universality | One can view the spreadsheet as an information node in a potentially larger information schema. It can be used as input or output to other environmental components. At the same time, it is in a human readable format and can be manipulated with a variety of tools ("comparable" to XML). |
| Minimalism | Many of the solutions that are out in the market attempt to solve a combination of problems at the same time. They compile a lot of information which becomes hard to navigate. In comparison, the spreadsheet can be quite a simple targeted data collection model. It allows you to focus on raw data that is of specific interest to you. |
| Portability | Thanks to OpenOffice [^] and GoogleDocs [^], there are alternative solutions to Microsoft Excel [^]. They provide means to work with spreadsheets on non-Windows machines and on the "cloud". |
| Flexibility | Spreadsheets allow you to add, edit, delete, search, format, annotate, and derive data and data relationships. A wide variety of functions [^] and charts are available for data manipulations and representation. |
| Programmability | The user is free to add, remove, show, or hide rows and columns. They can format, filter, validate, and reorganize spreadsheets to their liking and needs. With little knowledge of spreadsheets and tons of internet resources on it, the user can completely re-invent the template's data log, information querying, and reporting layout. |
| Performance | Performance varies between applications and their versions. Once the data log grows beyond 500 records, it is possible that you observe a second or two delay when you input your tasks. Also, GoogleDocs [^] only supports spreadsheets that are less than 1MB in size and a partial set of functions and charts, for now. |
(!) One way to increase performance is to use macros in place of some of the formulas in the template (e.g., [^]). Note that if you use macros, you'll sacrifice portability for speed.
The attached workbook has three main spreadsheets. Presently, they are Def (for all definitions), Log (for all daily tasks), and Qry (for all queries).
(+) You can rename the spreadsheets in the template to any title you like.
Def / Definitions
The following definitions are included:
| Activity | Analysis, Design, Development, CodeReview, Testing, Integration, Documentation, Deployment, Build, Question, Note, Bug/CR, Meeting, Operations, Training, and Research |
| Status | N/A, Open, In Progress, Pending, Completed, Cancelled |
| Priority | High, Medium, Low |
| Impact | High, Medium, Low |
| Risk | High, Medium, Low |
| Tag | N/A, <Component>, Other, All |
| Category | N/A, Maintenance, Investment, Process, Training |
| Peer | N/A, <User>, All |
(+) You can expand or shorten any of the definitions.
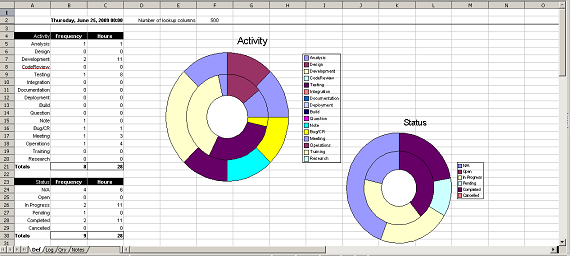
The spreadsheet tracks the use of these definitions and shows statistics on the frequency of occurrence and total amount of effort for each one and in total. The same information is visualized with the help of charts.
(+) Feel free to choose the charts you like for this purpose.

Log / Tasks
The following columns are included:
| RefID | Representing the parent of the task. While the system can hardly be called hierarchical, it suggests that entries can share a common frame of reference. |
| ID | Identifying the task's code. |
| Lnk | Linking the task to an external resource. |
| Activity | Linking the task to Activity. |
| Description | Containing notes, comments, feedback, points of interest, etc. |
| Added * | Referring to the task's creation date. |
| Est. * | Referring to the task's estimated amount of effort to completion. |
| Date | Referring to the task's entry date. It defaults to the task's added date. |
| Effort | Referring to the task's amount of effort ([Effort != Duration] [Cost Estimation]). |
| Left | Referring to the task's remaining amount of effort to completion. If the tasks has effort estimation, the cell is auto-populated based on the estimated effort and the total effort to date. |
| DueDate * | Referring to the task's target completion date. |
| Total | Referring to the task's total amount of effort to date. |
| % | Referring to the task's percent completed to date. It is calculated based on the total and remaining amount of effort. |
| Status * | Referring to the task's status in complement to percent completed. |
| Priority * | Referring to the importance / return of investment the task may have in terms of priority to the executive team and the rest of the stakeholders. |
| Impact * | Referring to the amount of change / added value the task may bring in terms of impact to user satisfaction. |
| Risk * | Referring to the amount of uncertainty the task may cause in terms of risk to timely completion, completeness, accuracy, performance, etc. |
| Tag * | Co-relating the task to a customized label from another environmental data collection. |
| Category * | Referring to a process the task pertains to. |
| Peer * | Referring to a peer that shares responsibility for the task. |
* If a task with the same code and activity has been previously entered, the cell is auto-populated.
(+) You can add, remove, or re-order any of the columns.
Qry / Queries
The following queries are included:
| By Date | Reports the work done for the current date (by default) and a user-specified date (if any). |
| By Month | Reports the work done for the current month (by default) and a user-specified month (if any). |
| By Year | Reports the work done for the current year (by default) and a user-specified year(if any). |
| By RefID | Reports the work done collectively for all tasks without a parent (by default) and for all tasks sharing a user-specified parent or a common reference frame (if any). |
| By ID | Reports the work done for a task identified by its code. Further, the report is broken down into activities and shows not only the effort but all task information styled as a task / project summary. |
Notes
Use this spreadsheet for free-form notes, comments, calculations, work-related tokens, etc.
| Measure | Ideally, project objectives are S.M.A.R.T. - specific, measurable, achievable, realistic, and time-bounded [^]. It is important to correctly identify targets and measure success. Historical data can reveal patterns that help predict the outcome of future endeavours. Then you can easily improve processes and ease decision-making. Questions of the form - "How many Code Reviews were performed", "What percentage of the time is spent in maintenance vs. process vs. investment vs. training?", "How much work was done in the first month of the year?", "What are all the bugs that have been fixed?", "What work was involved in making component "X""?, etc. - should have immediate answers. |
| Simplify | In the spirit of the Pareto Principle [^], 80% of task management can be achieved with 20% of the data. By eliminating indirect information, focus is set on the tangible facts of the tasks at hand. Rather than understanding how tasks and resources interweave at the corporate level, only data related to a single factor is manipulated. While you may not know whether the project is on time and within budget at a give time, you always know what your workload is. Questions of the form - "What are my outstanding tasks?", "What are my outstanding roadblocks?", "What solutions have I applied?", etc - should have immediate answers. |
| Reuse | We do not have to reinvent the wheel in order to measure and simplify task management. All the required features have been explored in more than one software product. We can easily rely on spreadsheets to accumulate data in a semi-formal "fast" way with a historical and a snapshot views. It presents an inexpensive, convenient, and risk-free solution. |
| Definitions | (+)You can add to the definitions by inserting before the last one and dragging the formula from above. |
| Columns | Columns are formatted for date-time and text. Some columns have data validation based on the definitions discussed earlier. Some columns have lookup values usually based on first match. Datetime columns do not have default values (but the current date is available from a drop-down) in order to ensure that the desired date is filled in.
(+)You can change the value (and overwrite the formula) in any of the columns as needed. |
| Formulas |
| First Index |
=MATCH($B6;$B$3:$B5;0)
Find the index of the first exact match. [^] | | Hyperlinks |
=IF(E4="";"";HYPERLINK(CONCATENATE
("http://tracker.kleinsystems.ca/browse/";E4);"^"))
Use the task ID, to link to the corporate JIRA site for external details of the task. | | Added |
=IF(ISERROR($C4);"";INDEX(I$3:I3;$C4))
Find the value of this column (I) in the first matching row(cf.First Index). Defaults to "", if no match is found. | | Est. |
=IF(ISERROR($C4);J$3;INDEX(J$3:J3;$C4))
Find the value of this column (J) in the first matching row (cf.First Index). Defaults to the value in cell J$3, if no match is found. | | Status |
=IF($E4="";"";IF(ISERROR
($C4);S$3;INDEX(S$3:S3;$C4)))
Find the value of this column (S) in the first matching row (cf.First Index) if and only if there is a value in $E4 (i.e., a task ID is provided). Defaults to the value in cell J$3, if no match is found. | | Total |
=IF($E4="";"";SUMIF($B$3:$B4;"="
&CELL("contents";$B4);$N$3:$N4))
Sum the values of this column (N) for all matching entries if and only if there is a value in $E4 (i.e., a task ID is provided). | | Frequency |
=COUNTIF(OFFSET($Log.W$4;0;0;$F$2;1);"="
&CELL("contents";$A51))
Count the values of this column (W) for all matching entries. An offset is provided to indicate how far to search. By default, it looks at the first 500 records. | | Hours |
=SUMIF(OFFSET($Log.W$4;0;0;$F$2;1);"="
&CELL("contents";$A51);
OFFSET($Log.N$3;0;0;$F$2;1))
Sum the values of this column (W) for all matching entries. An offset is provided to indicate how far to search. By default, it looks at the first 500 records. | | Last Index |
=SUMPRODUCT(MAX((((OFFSET($Log.$B$3;0;0;$J$2;1)=
$A19)*ROW((OFFSET($Log.$B$3;0;0;$J$2;1)))))))-2
Find the index of the last match. It is used to find the totals, etc. for the tasks summary report on the Qry spreadsheet. [^] |
|
- 2009-07-05: Published on CodeProject
- 2009-06-28: First draft


 General
  News
News  Suggestion
  Question
  Bug
Bug  Answer
  Joke
Joke  Praise
  Rant
Rant  Admin
Admin 


