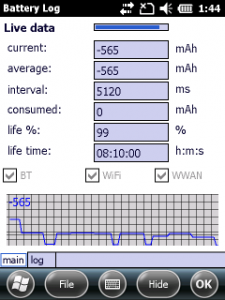
This is a very simple application to show the values of GetSystemPowerStatusEx2 in live view.
That enables you to see how much power is drawn of the battery if you switch WiFi on or off for example.


On industrial devices, you can also check the power consumption of special modules like a barcode scanner.
The power current values shown are negative if the power is drawn off the battery. Do not misunderstand this. A -565mA value says that the battery draw current is 565mA (dis-charging). If you read a positive value, the battery is currently charging.
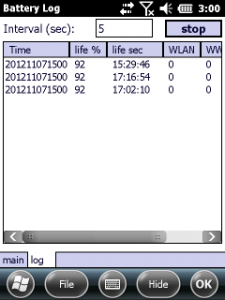
The app can also been hidden and run in background and log the battery life time and percent to a file.
201211071400    97    17:33:00    1    0    0
201211071401    97    17:21:35    1    0    0
201211071401    97    17:21:35    1    0    0
201211071404    97    17:30:08    1    0    0
201211071404    97    17:10:24    1    0    0
201211071405    97    14:16:30    1    0    0
201211071405    97    12:26:06    1    0    0
201211071405    97    12:26:06    1    0    0
201211071405    97    12:26:06    1    0    1
201211071405    97    11:45:27    1    0    1
201211071405    97    11:45:27    1    0    1
201211071405    97    11:01:41    1    0    1
201211071405    97    11:01:41    1    0    1
The first column shows the date time in an Excel friendly form, then the life percent and the estimated remaining life time is listed. The next three columns represent the status of WiFi, WWAN, and Bluetooth.
Although there is no special with the code, here are some snippets:
The perfChart initialization:
perfChart1._SymmetricDisplay = true;
perfChart1._ScaleMode = SpPerfChart.ScaleMode.Relative;
perfChart1.BackColor = Color.LightGray;
perfChart1.ForeColor = Color.Black;
SpPerfChart.PerfChartStyle perfStyle = new SpPerfChart.PerfChartStyle();
SpPerfChart.ChartPen cpen = new SpPerfChart.ChartPen();
cpen.Color=Color.Blue;
cpen.Width=2;
perfStyle.ChartLinePen = cpen;
perfStyle.BackgroundColorBottom = Color.LightGray;
perfStyle.BackgroundColorTop = Color.LightGray;
perfChart1._PerfChartStyle = perfStyle;
Adding a new value to perfChart:
void timerStatus_Tick(object sender, EventArgs e)
{
    if (iStatusTimerCount > 9)
    {
        iStatusTimerCount = 0; progressBar1.Value = iStatusTimerCount;

        txtBatteryCurrent.Text = _batterStatus._BatteryCurrent.ToString();
        perfChart1._AddValue(_batterStatus._BatteryCurrent);
...
If you already know perfChart, you see that I added some options. The perfChart can now hold positive and negative values and will still scale automatically.
This member has not yet provided a Biography. Assume it's interesting and varied, and probably something to do with programming.


