In this article, you will see a brief introduction about linear correlation coefficient between ordinal variables along with a sample application.
Introduction
One of the most widely used measures of association between variables that are ordinal is the linear correlation coefficient. This article will give a brief introduction on this with a sample application. Given a business data of profit and sales, we will give a descriptive statistics summary on each attribute and compute its correlation.
Background
The analysis of data inevitably involves some trafficking with the field of statistics, that gray area which is not quite a branch of mathematics - and just as surely not quite a branch of science.
Data is a collection of objects and their attributes. An attribute is a property or characteristic of an object. So, a collection of attributes describes an object. There are four types of attributes:
- Nominal
- Ordinal
- Interval
- Ratio
Qualitative data includes the following:
- Nominal (category): the existence of choice without order
- Ordinal (order, index): has a sequence, or order of choice
Interval and Ratio are Quantitative data:
- Interval: Temp in Fahrenheit or Celcius, Calendar date
- Ratio: Temp in Kelvin, length, time
Nominal/Ordinal Variable Example
Gender is a nominal variable with a value of 1=male and 2=female. Gender can also be relabeled and changed to reverse order like 5=Female and 225=Male. Both examples are valid as long as they are consistent throughout our definition. For ordinal variables, however, ordering matters. The sequence of our label is based on its rank. A rank of priority can be 1=Best. A higher value has a lower importance. For example: 1= very dissatisfied, 100= very satisfied.
In summary, the value of an ordinal attribute provides enough information to order objects. The operations that can be performed on ordinal variables can be the following: median, percentile, rank, correlation, run tests, sign tests ...
To understand the data, we need to have a preliminary exploration of the data to better understand its characteristics. In the case of this article, we will look at some statistical methods.
Covariance & Correlation
Wikipedia defines covariance as a measure of how much two variables change together. However, Wolfram MathWorld defines covariance as providing a measure of the strength of the correlation between two or more sets of random variants. In general, a correlation gives the strength of the relationship between variables.
So, for pairs of quantities (xi; yi); i = 1,...,N, the linear correlation coefficient, r (also called the product-moment correlation coefficient, or Pearson's r) is given by the formula:
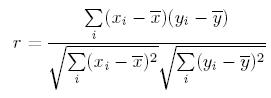
where, as usual, x is the mean of the xis, y is the mean of the yis.
Wikipedia defines Pearson's Correlation Coefficient with the following formula:

If we have a series of n measurements of X and Y written as xi and yi where i = 1, 2, ..., n, then the sample correlation coefficient can be used to estimate the population Pearson correlation between X and Y, where x and y are the sample means of X and Y, sx and sy are the sample standard deviations of X and Y.
Source: Numerical recipes:
The value of r lies between -1 and 1, inclusive. It takes on a value of 1, termed complete positive correlation, when the data points lie on a perfect straight line with positive slope, with x and y increasing together. The value 1 holds independent of the magnitude of the slope. If the data points lie on a perfect straight line with a negative slope, y decreasing as x increases, then r has the value -1; This is called complete negative correlation. A value of r near zero indicates that the variables x and y are uncorrelated.
When a correlation is known to be significant, r is one conventional way of summarizing its strength. In fact, the value of r can be translated into a statement about what residuals (root mean square deviations) are to be expected if the data is fitted to a straight line by the least-squares method.
Unfortunately, r is a rather poor statistic for deciding whether an observed correlation is statistically significant, and/or whether one observed correlation is significantly stronger than another. The reason is that r is ignorant of the individual distributions of x and y, so there is no universal way to compute its distribution in the case of the null hypothesis.
About the only general statement that can be made is this: If the null hypothesis is that x and y are uncorrelated, and if the distributions for x and y each have enough convergent moments (tails die off sufficiently rapidly), and if N is large (typically> 500), then r is distributed approximately normally, with a mean of zero and a standard deviation of 1 divided by square root of N. In that case, the (double-sided) significance of the correlation, that is, the probability that jrj should be larger than its observed value in the null hypothesis, is:
where erfc(x) is the complementary error function.
Implementation / Data
Month 01 02 03 04 05 06 07 08 09 10 11 12
Profit 525 300 450 300 400 500 550 125 300 400 500 550
Sales 250 225 275 350 325 375 450 400 500 550 600 525
public static void GetPearson(double[] x, double[] y,
ref Double r, ref Double prob)
{
const double TINY = 1.0e-20;
int j, n = x.Length;
Double yt, xt, t, df;
Double syy = 0.0, sxy = 0.0, sxx = 0.0, ay = 0.0, ax = 0.0;
for (j = 0; j < n; j++) {
ax += x[j];
ay += y[j];
}
ax /= n;
ay /= n;
for (j = 0; j < n; j++) {
xt = x[j]-ax;
yt = y[j]-ay;
sxx += xt*xt;
syy += yt*yt;
sxy += xt*yt;
}
r = sxy / (Math.Sqrt(sxx*syy) + TINY);
double z = 0.5 * Math.Log((1.0 + r + TINY) / (1.0 -r + TINY));
prob = erfcc(Math.Abs(z * Math.Sqrt(n - 1.0)) / 1.4142136);
}
public static Double erfcc(Double x)
{
Double t, z, ans;
z = Math.Abs(x);
t = 1.0 / (1.0 + 0.5 * z);
ans = t * Math.Exp(-z * z - 1.26551223 + t * (1.00002368 +
t * (0.37409196 + t * (0.09678418 +
t * (-0.18628806 + t * (0.27886807 +
t * (-1.13520398 + t * (1.48851587 +
t * (-0.82215223 + t * 0.17087277)))))))));
return x >= 0.0 ? ans : 2.0 - ans;
}
To Test the Function
double[] x = new double[4]{525, 300, 450, 300, 400, 500,
550, 125, 300, 400, 500, 550};

double[] y = new double[4]{250, 225, 275, 350,
325, 375, 450, 400, 500, 550, 600, 525};

double r = 0, prob = 0;
GetPearson(x, y,ref r,ref prob);
The same output is computed via Excel's Pearson and Correl function:
Other statistical functions that can be performed on the data include the following: Min, Max, Median, Mean and Mode.
public static ArrayList CalculateMode(params int[] array)
{
ArrayList mode = new ArrayList();
int[] sortArray = new int[array.Length];
int[,] frequency = new int[array.Length, 2];
Array.Copy(array, sortArray, array.Length);
Array.Sort(sortArray);
int tmp = sortArray[0];
int index = 0;
int i = 0;
while (i < sortArray.Length)
{
frequency[index, 0] = tmp;
while (tmp.Equals(sortArray[i]))
{
frequency[index, 1]++;
i++;
if (i > sortArray.Length - 1)
break;
}
if (i < sortArray.Length)
{
tmp = sortArray[i];
index++;
}
}
Array.Clear(sortArray, 0, sortArray.Length);
for (i = 0; i < sortArray.Length; i++)
sortArray[i] = frequency[i, 1];
Array.Sort(sortArray);
index = sortArray.Length - 1;
switch (sortArray[index])
{
case 0:
mode.Add("none");
break;
case 1:
mode.Add("none");
break;
default:
for (i = 0; i < frequency.Length / frequency.Rank; i++)
if (frequency[i, 1].Equals(sortArray[index]))
mode.Add(frequency[i, 0].ToString());
break;
}
return mode;
}
public static double CalculateMedian(params int[] pNumbers)
{
int len = pNumbers.Length;
if (len == 0)
throw new System.ArgumentException("No data");
int size = pNumbers.Length;
int mid = size / 2;
double median = (size % 2 != 0) ? (double)pNumbers[mid] :
((double)pNumbers[mid] + (double)pNumbers[mid - 1]) / 2;
return median;
}
public static double CalculateMean(params int[] data)
{
int len = data.Length;
if (len == 0)
throw new System.ArgumentException("No data");
double sum = 0;
for (int i = 0; i < data.Length; i++)
sum += data[i];
return sum / len;
}
public static int CalculateMin(params int[] rest)
{
int min = rest[0];
foreach (int next in rest)
{
min = Math.Min(min, next);
}
return min;
}
public static int CalculateMax(params int[] rest)
{
int max = rest[0];
foreach (int next in rest)
{
max = Math.Max(max, next);
}
return max;
}
Covariance: The covariance is especially useful when looking at the variance of the sum of two random variants. It provides a measure of the strength of the correlation between two or more sets of random variants.
Note: The correctness of the implementation has not been tested.
public static void GetCovar(double[,] matrix)
{
int x = matrix.GetLength(0);
int y = matrix.GetLength(1);
Double[,] SubMeansResult = new double[x, y];
for (int i = 0; i < y; i++)
{
var tmp = 0d;
for (int j = 0; j < x; j++)
{
tmp += matrix[j,i];
}
var mean = tmp / x;
for (int j = 0; j < x; j++)
{
SubMeansResult[j,i] = matrix[j,i] - mean;
}
}
Double[,] Transresult = new double[y, x];
for (int i = 0; i < x; i++)
for (int j = 0; j < y; j++)
Transresult[j, i] = matrix[i, j];
y = SubMeansResult.GetLength(0);
x = Transresult.GetLength(1);
Double[,] MultiplyResult = new double[x, y];
for (int i = 0; i < x; i++)
for (int j = 0; j < y; j++)
{
double temp = MultiplyResult[i, j];
for (int k = 0; k < x; k++)
{
temp += Transresult[i, k] * SubMeansResult[i, k];
}
MultiplyResult[i, j] = temp;
}
for (int i=0; i<x; i++)
{
for (int j = 0; j < y; j++)
{
double tmp = MultiplyResult[i,j];
tmp /= y - 1;
MultiplyResult[i,j] = tmp;
}
}
}
}
References
- Kardi Teknomo PHD - Data attribute exploration
- Numerical Recipes - William Press et. al
- Wikipedia
- Open Source community
History
- 31st December, 2009: Initial version
- 11th March, 2021: Article updated
My name : Aresh Saharkhiz.
Origin: Unknown
Education : BS Computer Science
MS Computer Science
Interests : Genetic Programming
Neural Networks
Game AI
Programming: (language == statementEnd(semicolon)
http://sites.google.com/site/docaresh
Skill:
Flash
Carrara 3D
PHP,ASP,ASP.NET
J2SE


 General
  News
News  Suggestion
  Question
  Bug
Bug  Answer
  Joke
Joke  Praise
  Rant
Rant  Admin
Admin 


