Know what your JavaScript application is up to after it has gone into production.
Introduction
A JavaScript application is like your favorite child.
You shower it with love, prepare it for life the best way you can, and then send it
into production where it faces users that do things you never imagined and servers slower than you thought possible.
The issue is that now your application is live, there will be users. If the users are not happy, they will complain to your
manager (or your client). This in turn has the potential to make you unhappy. You don't want unhappy users.
To keep your users happy, you want to know whether their experience is good and if not, fix it. In restaurants, the waiter comes to your table
and asks if everything is ok. You could call your users, but unless you have only a few, it is easier to ask your application instead. After all,
it can talk to you in a way a restaurant meal can't.
Specifically, you will want to know about:
- Exceptions. Any syntax error or undefined variable will cause one of these. Yes, they will happen no matter how well you craft and test your code.
- Failed AJAX requests. You'll want to know about unreliable servers.
- Lengthy AJAX requests. A user still looking at a spinner after 10 seconds is not a happy user.
When a request takes too long, you want to know about it, so you know how often it happens, which server is involved, etc.
- Debug data. Users are reporting bugs that you can't reproduce in your dev environment.
So you add code to tell you what's going on in production. You want to control this from a central point, without
adding and removing lines deep inside your code.
Ok, so you need client side logging. However:
- You don't want to be swamped with log data. You'll want filters to give you only the good stuff.
- The log data needs to go into your server side logs. That way, you can get at it.
- You'll want to correlate client side and server side log data, so you know what log data refers to the same request.
- Ideally, you could control everything via a configuration file on the server, without changing your JavaScript code.
There are many logging packages for JavaScript, including
JSLog,
Log4js and
log4javascript.
In this article, you'll meet
JSNLog, a relatively new JavaScript package that ticks all these boxes. It is open source, and at 1.5kb about the size of a small image.
It is also very well integrated with ASP.NET MVC and Webforms, and has integration with PHP as well.
If you like this article, please vote for it.
Contents of this series
Let's do some logging
First
Download and install JSNLog.
Then to log something to the server, in your JavaScript write something like this:
JL().info("log message");
This calls function JL(), which returns a logger. It then calls function info on that logger to log an info message.
JSNLog provides lots of options, named loggers, etc. But if you simply want to log something, this is all it takes.
You can pass in strings, objects and functions. If you pass in a function, it will execute the function and then log whatever the function returns.
It not only sends the log data, but also the time, browser type, etc.
How it works
The JavaScript logger takes the message and hands it off to the AJAX appender, a piece of code inside JSNLog that sends the
log message to the server running your MVC or Webforms site or your PHP site.
The JSNLog server side component then stores the log message in your server side log, using whatever logging package you already
use (for .Net supports Log4Net, NLog, Elmah and Common.Logging).
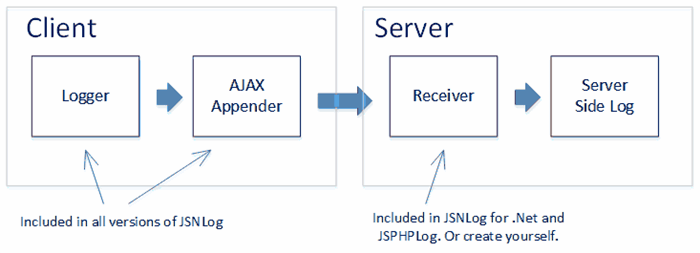
There are JSNLog editions for .Net and for PHP.
If you use Java, Python or some other technology for which there is no server side component,
you can use the stand alone
JSNLog.js library.
The
JSNLog documentation has the
format of the log messages, making it easy to create a server side component yourself.
If terms such as "appender" and "info" have a familiar ring, that makes sense.
JSNLog gets its inspiration from Log4J and its offshoots, but then adds its own sauce in the form of
a shortened and simplified syntax and features to make it work better on the client.
The remainder of this article assumes you have an ASP.NET MVC or Webforms web site.
It shows how to control your JavaScript loggers from your server side web.config file, where all JSNLog definitions sit
inside the <jsnlog> element.
Note however that you can just as easily configure your loggers in your JavaScript (how).
Also, JSNLog comes with sensible configuration defaults, so for simple logging you don't need to do configuration at all.
Console Appender
During development it can be useful to simply send log items to the console provided by the F12 developer tools in Chrome, Firefox and Internet Explorer.
To enable this, JSNLog includes a
Console Appender.

Real world scenarios
To log any exceptions so you know there is a bug in your code,
you can use windows.onerror. This handler is invoked
by the browser for each uncaught exception:
window.onerror = function myErrorHandler(errorMsg, url, lineNumber) {
JL().fatal("Exception - " + errorMsg + ", url: " + url + ", line number: " + lineNumber);
return false;
}
If instead of all exceptions you are only interested in exceptions in some specific piece of code, you could use
try catch:
try {
}
catch (e) {
JL().fatalException("message", e);
}
fatalException
takes both a message and an exception. These will both be logged in the same log message.
On Chrome, Firefox and IE10 and higher, a stack trace will be logged as well.
To get a log message if an AJAX request has failed, or has taken too long:
var msBeforeAjaxCall = new Date().getTime();
<a href="https://api.jquery.com/jQuery.ajax/">$.ajax</a>( "url" )
.done(function() {
alert( "success" );
})
.fail(function() {
JL().error("Request to ..... failed.");
})
.always(function() {
var msAfterAjaxCall = new Date().getTime();
var timeTakenInMs = msAfterAjaxCall - msBeforeAjaxCall;
if (timeTakenInMs > 10000) {
JL().error("Request to ..... took " + timeTakenInMs + " ms.");
}
});
Reducing generated log data
One problem with loggers is that they can generate a lot of useless data.
JSNLog includes many options to get the data you actually want.
Switching JavaScript loggers on and off
When you log something, you can give it severity:
JL().trace("message with severity trace");
JL().debug("message with severity debug");
JL().info("message with severity info");
JL().warn("message with severity warn");
JL().error("message with severity error");
JL().fatal("message with severity fatal");
You've already seen info(), error() and fatal() in the examples above.
To filter out all messages below a given severity:
<!--Only send error and fatal log messages-->
<logger name="" level="ERROR" />
To stop all messages:
<!--Stop all messages-->
<logger name="" level="OFF" />
Named loggers
If you do logging in multiple places,
having just one logger quickly gets limiting.
What if you want to have debug logging
in some functions, but only error logging everywhere else?
The solution is to use named loggers:
<!--Set options on logger1. If it does not exist, it will be created.-->
<logger name="logger1" level="DEBUG" />
<!--Set other options on logger2. This does not affect logger1.-->
<logger name="logger2" level="ERROR" />
In your JavaScript code, using named loggers looks like this:
JL("logger1").error("message from logger1");
In applications with dozens of loggers, setting options for each one individually can get boring.
Because of this, JSNLog uses the same
inheritance mechanism as Log4J and Log4Net. Here is how this works:
- Logger names can have multiple parts separated by periods, such as "abc.def" and "abc.def.ghi".
- If the parts of a logger name match the first parts of another logger name, than the first logger is called the parent of the other logger. For example:
- The parent of logger "abc.def.ghi" is logger "abc.def".
- The parent of logger "abc.def" is logger "abc".
- The parent of logger "abc" is the root logger.
Loggers inherit their options from their ancestors. So if you set options on logger "abc", then "abc.def", "abc.def.ghi"
and all other descendents of
"abc" get the same options, unless you specifically override them.
The root logger is the only logger without a name. As you saw in the beginning of this article, you access it by simply leaving out the name:
<!--Set options on root logger-->
<logger name="" level="ERROR" />
<!--Or leave out the name attribute altogether-->
<logger level="ERROR" />
Now that you've seen how to filter messages by severity and how to configure multiple JavaScript loggers through inheritance,
let's have a look at the other options.
Filter by regular expression
Sometimes it's just not worth the time to fix some rare exception.
Or there is a third party component throwing exceptions and there is nothing you can do about it.
The disallow option suppresses all messages that match a given
regular expression. If you're logging an object,
it will be converted to JSON and then matched:
<!--Suppress messages that match regular expression [Ss]uppress\s+me-->
<logger name="" disallow="[Ss]uppress\\s+me" />
Filter by browser type
Imagine trying to solve a bug that only happens with everybody's favorite browsers, IE 7 and 8.
You want to switch on the JavaScript logger, but only for those browsers.
The userAgentRegex option is your friend here. It disables the logger, except if the client's
user agent string
matches a given
regular expression:
<!--Disable logger, except for IE 7 and IE 8-->
<logger name="" userAgentRegex="MSIE 7|MSIE 8" />
Filter out (near) duplicates
Imagine having a loop that executes 50 times, and somewhere in that loop
a logger decides to send a message. You would get the same message 50 times, like this. Ouch!
Something is wrong - x = 1
Something is wrong - x = 2
Something is wrong - x = 3
...
Something is wrong - x = 49
Something is wrong - x = 50
The onceOnly option will get rid of the near duplicates for you. It takes one or more
regular expressions.
When it sees a message that matches one of those, it remembers that it has seen a message matching that particular regular expression. If it gets another message
matching that regular expression, it will suppress it.
<!--Send only one message that matches regular expression "Something is wrong - x ="-->
<logger name="" onceOnly="Something is wrong - x =" />
With the onceOnly option in place, you get only the first message:
Something is wrong - x = 1
Limit number of messages
You can set the maxMessages option to
limit the total number of messages sent by the client.
This is a blunt instrument, because it stops sending messages after the limit is reached,
regardless of which JavaScript loggers are trying to send or the severity of the messages.
<!--Ensure that the client sends no more than 3 log messages-->
<jsnlog maxmessages="3" >
</jsnlog>
Note that this option is applied to the <jsnlog> element itself.
That's because this option applies to the entire JSNLog library, not to an individual logger.
Only send debug messages if an exception happens
When an exception happens, it is not always clear why it happened. So you may need to generate debug messages
in several places
to find the cause:
window.onerror = function myErrorHandler(errorMsg, url, lineNumber) {
    JL().fatal("Exception - " + errorMsg + ", url: " + url + ", line number: " + lineNumber);
    return false;
}
function abc(x) {
    JL().debug("abc: x=" + x);
    ...
}
function def(y) {
    JL().debug("def: y=" + y);
    ...
}
The issue is that you want the debug information, but only if there is an exception. If there is no exception, the debug information is
of no value.
To solve this, you can store the debug messages in browser memory, and only send them to the server if there
is a fatal message. Because this may involve multiple named JavaScript loggers, this is configured on
the AJAX appender - the JSNLog component that receives messages from the JavaScript loggers and sends them to the server.
The following code will make this all work. For details, see the JSNLog documentation.
<!--Create new appender-->
<ajaxAppender
    name="appender1"
    storeInBufferLevel="DEBUG"
    level="ERROR"
    sendWithBufferLevel="FATAL"
    bufferSize="20"/>
<!--Tell the root logger to send all messages to the new appender-->
<logger appenders="appender1"/>
What's the result of this magic?
- A new appender is created.
- The root logger is told to send all its messages to the new appender. Because the root logger is the ancestor of all loggers,
any other loggers you have will now also send their messages to the new appender.
- When the appender receives from a logger a message with severity debug or higher, it is stored in a memory buffer.
- When it receives a message with severity error or higher, it is not buffered but sent to the server. Everything else in the buffer stays in the buffer though.
- When it receives a message with severity fatal, it is sent to the server along with all messages in the buffer.
- The buffer holds no more than 20 messages. If another message needs to be stored, the oldest message in the buffer is removed.
This way, you can generate as much debug data as you want without worrying about being swamped,
because it will only be sent when you actually need it.
Correlating all messages related to a request
In a complicated application, you may get several log messages for a single request, some generated on the server, some generated on the client.
You will want to tag each log message with a request id. That way, you can sort your log by request id and time stamp to get a unified picture of what happened
for each request, first on the server and later on the client.
The JSNLog version for .Net
generates a unique id for each request. When a JavaScript logger sends a log message, that message includes the request id, so it can be logged in
your server side log.
It also provides a server side method
RequestId,
which
gives you the same id. That way, you can include the same request id when a server side logger logs a message.
JSNLog uses the same request id that is used internally by IIS. This way, you can correlate with tracing done using
Event Tracing for Windows
(ETW).
If you do not have ETW tracing switched on, JSNLog generates a random GUID.
Advanced options
JSNLog supports more advanced options that are beyond the scope of this article.
These include
batching of multiple log messages
in one request to improve efficiencies, and
filtering by client ip address
to investigate problems reported by a particular user.
Conclusion
Once your JavaScript has gone live, it is prone to unexpected events, such as exceptions, failed AJAX requests and AJAX requests that take too long.
To find out about these issues so you can fix them quickly, you need to log them to your server side log.
JSNLog is a relatively new client side logging package. Heavily optimized for life on the client,
it sends log messages to the server running your MVC or Webforms or PHP site and includes many options to reduce the volume of log messages.
The
next part,
will show in detail all JavaScript functions provided by JSNLog.


 General
  News
News  Suggestion
  Question
  Bug
Bug  Answer
  Joke
Joke  Praise
  Rant
Rant  Admin
Admin 


