Introduction
This article explains debugging Memory Leaks in easy and simpler way for Windows Applications. The scope of this article is limited to user-mode debugging. This article covers very basic debugging using Perfmon.
Note:This is series of articles divided into 5 parts
Part 1: Windows Debugging Techniques - Debugging Application Crash (Windbg)
Part 2: Windows Debugging Techniques - Debugging Application Crash (DebugDiag, AppVerifier)
Part 3: Windows Debugging Techniques - Debugging Application Crash (Self Dump Generation)
Part 4: Windows Debugging Techniques - Debugging Memory Leaks (Perfmon)
Part 5: Windows Debugging Techniques - Debugging Memory Leaks (CRT APIs)
Background
One of the most common problems with native code is memory leaks, the major reason being that memory management is left to the application itself.
It is the Application's responsibility to allocate and de-allocate the memory. When an application dynamically allocates memory, and does not free that memory when it is finished using it, that program has a memory leak. The memory is not being used by the application anymore, but it cannot be used by the system or any other program either.
Definition
First let's try and understand the basics of the memory. Let's begin with "Virtual Address Space."
The virtual address space for a process is the set of a virtual memory addresses that it can use.
The address space for each process is private and cannot be accessed by other processes unless it is shared.
Any operation which is being done in the process like allocating memory, creating static objects etc.
Everything resides inside VAS. All four segments of memory: Code Segment, Stack Segment, Data Segment and Heap reside inside VAS.
Consider the picture below:
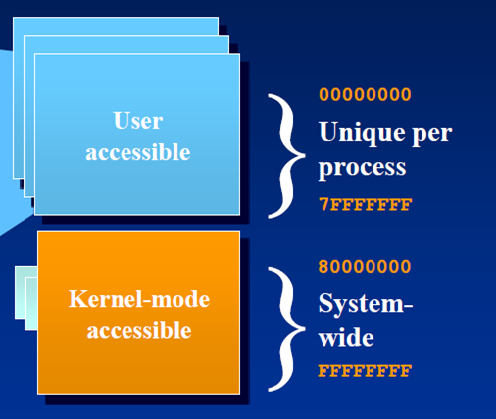
We see here that the Address space is being divided into two parts user mode and kernel mode.
Both user mode and Kernel mode have 2GB of VAS. The difference is that 2GB of Kernel mode is shared across the processes running system wide.
The user mode space is dedicated for the process, i.e. all the memory allocations resides in this space. This is something private to the process.
For example, allocating memory using "new" will add to the user mode space. Creating an Event Object, Mutex Object etc. will add up to the kernel mode space, since these are Kernel mode objects.
Now let's discuss how to understand whether a particular API will occupy user mode space or a kernel mode space.
If an API has SECURITY_ATTRIBUTES as a parameter than it means it will create a kernel mode object and SECURITY_ATTRIBUTES will decide its accessibility to other processes.
Few examples of these APIs are
HANDLE WINAPI CreateEvent(
  _In_opt_  LPSECURITY_ATTRIBUTES lpEventAttributes,
  _In_      BOOL bManualReset,
  _In_      BOOL bInitialState,
  _In_opt_  LPCTSTR lpName
);
HANDLE WINAPI CreateMutex(
  _In_opt_  LPSECURITY_ATTRIBUTES lpMutexAttributes,
  _In_      BOOL bInitialOwner,
  _In_opt_  LPCTSTR lpName
);
CreateThread is little different in this case
HANDLE WINAPI CreateThread(
  _In_opt_   LPSECURITY_ATTRIBUTES lpThreadAttributes,
  _In_       SIZE_T dwStackSize,
  _In_       LPTHREAD_START_ROUTINE lpStartAddress,
  _In_opt_   LPVOID lpParameter,
  _In_       DWORD dwCreationFlags,
  _Out_opt_  LPDWORD lpThreadId
);
Even though Thread is a kernel mode object, when it gets created it occupies 1MB of stack space in the user mode by default. This means we can have maximum of 2048 threads on a 32 bit OS since this will occupy complete 2GB of user mode space.
The default stack size can be altered via Project Settings in Visual Studio this will allow to create more threads.
This is a general distribution of VAS on 32 bit OS.
Further, VAS is divided into pages with each page being size of 4KB. So the max number of pages that a VAS can have is 1024*1024=1048576.
So now we understand when we cross this our application will stop working since there is no more memory available.
And when we are close to this System, it gives a message saying, "Low on Virtual Memory."
On 64Bit System User mode space is 6TB and Kernel Mode space is 2TB. So the process has a much, much bigger space to grow as compared to 32 bit.
This is just the basics of memory, to understand in more detail please refer Windows Internals book.
What Causes Memory Leaks ??
There are three very basic reasons:
1. Growing Heap : Memory is allocated but not de-allocated i.e malloc is being called but free is not called / new is called but delete is not called. This indirectly means Heap is growing but is not released back, which in turn keeps increasing Virtual memory,
if it crosses the specified limit, application would certainly crash
int main()
{
	for(int i = 0; i < 10; i++)
	{
		char* p = new char[100];
	}
	return 0;
}
2. Handle Leaks : This would happen with different handles that are created but not freed, Example File Handle, Thread Handle, Process Handle etc.
int main()
{
	HANDLE hEvent = NULL;
	hEvent = CreateEvent(NULL, TRUE, FALSE, TEXT("WriteEvent"));
	return 0;
}
3. Thread Count: This would happen if the threads are continuously getting created but are not actually exiting after their task completion.
As explained earlier this would actually occupy 1MB of user mode space by default, so if threads keep on increasing and they do not get released.
This would eventually lead to increase in Virtual Memory.
Debugging Techniques
Debugging Memory Leaks is one of the most complex problems. There are tools available like Rational Purifier, Insure++ etc.
But finding the precise issue requires a great deal of walking through code and an overall understanding of the scenario.
Apart from this, most of the tools for memory leak analysis are paid ones, and not all organisations really promote that.
So it should be possible to fix such issues with freely available tools with Windows OS.
The first and the most handy tool to simply identify whether there is a leak or not is "Performance Monitor".
Performance monitor is an inbuilt tool with windows OS which is used to measure various parameters such as: memory, CPU, Disk etc. of an application or on system wide level.
Consider the code below as an Example for memory leak:
#include <iostream>
#include <Windows.h>
#include <tchar.h>
#include <string>

using namespace std;

bool GetComputerName(wstring& wstrCompName);
bool fileread(const wstring& filepath);
bool GetUserName(wstring& wstrUserName);

int main()
{
	int nChoice = 0;
	wstring wstrCompName;
	wstring wstrUserName;
	char ccontinue = '\0';

	do
	{
		wcout<<L"Enter your choice"<<endl;
		wcout<<L"1.Read Computer name"<<endl;
		wcout<<L"2.Read User Name"<<endl;
		cin>>nChoice;

		switch(nChoice)
		{
		case 1:
			GetComputerName(wstrCompName);
			wcout<<L"Computer name read is"<<wstrCompName.c_str()<<endl;
			break;
		case 2:
			GetUserName(wstrUserName);
			wcout<<L"user name read is"<<wstrUserName.c_str()<<endl;
			break;
		default:
			wcout<<L"Invalid option";
		}
		wcout<<"Do you want to continue Y or N";
		cin>>ccontinue;
	}while(ccontinue == 'y' || ccontinue == 'Y');
	return 0;
}


bool GetComputerName(wstring& wstrCompName)
{
	wchar_t* pwszCompName = NULL;
	DWORD dwSize = 0;
	bool bRet = false;

	if (!GetComputerNameEx(ComputerNameDnsHostname, pwszCompName, &dwSize))
	{
		if(GetLastError() != ERROR_MORE_DATA)
		{
			wcout<<L"GetComputerNameEx Failed with Error Code"<<GetLastError();
			return false;
		}
		pwszCompName = new(std::nothrow) wchar_t[dwSize + 1];
		if(pwszCompName == NULL)
		{
			wcout<<L"unable to allocate memory"<<endl;
			return false;
		}
		memset(pwszCompName, L'\0', dwSize + 1);
		if (!GetComputerNameEx(ComputerNameDnsHostname, pwszCompName, &dwSize))
		{
			wcou<<L"GetComputerNameEx Failed with Error Code"<<GetLastError();
			return false;
		}
	}
	char* test = new char[1024*1024];
	wstrCompName.assign(pwszCompName);
	return true;
}


bool GetUserName(wstring& wstrUserName)
{
	wchar_t* pwszUserName = NULL;
	DWORD dwSize = 0;

	if(!GetUserName(pwszUserName, &dwSize))
	{
		if(GetLastError() != ERROR_INSUFFICIENT_BUFFER)
		{
			wcout<<"GetUserName returned with Error"<<GetLastError();
			return false;
		}
		pwszUserName = new(std::nothrow)wchar_t[dwSize + 1]();
		if(pwszUserName == NULL)
		{
			return false;
		}
		if(!GetUserName(pwszUserName, &dwSize))
		{
			if(pwszUserName)
			{
				delete [] pwszUserName;
				pwszUserName = NULL;
			}
			wcout<<"GetUserName returned with Error"<<GetLastError();
			return false;
		}
	}
	wstrUserName.assign(pwszUserName);
	if(pwszUserName)
	{
		delete [] pwszUserName;
		pwszUserName = NULL;
	}
	return true;
}
Having a look at the code we can make out that there is a leak in the function GetComputerName, which should be fixed.
There are two leaks: One is that the variable pwszCompName not been freed and the variable test is being allocated and not freed.
But this won't always be the case, and we will be have much more complex code to deal with.
Let's go Step-by-Step, identifying and fixing the problem
Step1:Add the performance counters in the perfmon tool
- Launch the performance monitor as shown below

- Add the performance counters for the Application, by selecting the parameters under process section
- View the graph of the Added Parameters
Step 2: Run the use cases and monitor the graph
As per our current implementation, select option 1 and then see the growth of the "private bytes"
Select Y to continue and again select option 1 and see the growth of "private bytes"
Now once select option 2 and observe the growth.
Private Bytes are growing only when option 1 is being selected.
The growth of private bytes indicates that there is a dynamic allocation happening which is not being released.
In other words, new/malloc is being done but free/delete is not being called.
Below shown is the graph for the current use case, Private Bytes is the Red Line which keeps growing.
Step 3: Trace the Code Flow and Fix the issue
As now we have identified that issue is there by selecting option 1, which means we should start tracing the code in that direction.
Let's enter the function GetComputerName. So we see that the variable pwszCompName is not being freed and variable test is not being freed. Let's change the above code below which will eventually fix the issue.
bool GetComputerName(wstring& wstrCompName)
{
	wchar_t* pwszCompName = NULL;
	DWORD dwSize = 0;
	bool bRet = false;

	if (!GetComputerNameEx(ComputerNameDnsHostname, pwszCompName, &dwSize))
	{
		if(GetLastError() != ERROR_MORE_DATA)
		{
			wcout<<L"GetComputerNameEx Failed with Error Code"<<GetLastError();
			return false;
		}
		pwszCompName = new(std::nothrow) wchar_t[dwSize + 1];
		if(pwszCompName == NULL)
		{
			wcout<<L"unable to allocate memory"<<endl;
			return false;
		}
		memset(pwszCompName, L'\0', dwSize + 1);
		if (!GetComputerNameEx(ComputerNameDnsHostname, pwszCompName, &dwSize))
		{
			if(pwszCompName)
			{
				delete [] pwszCompName;
				pwszCompName = NULL;
			}
			wcout<<L"GetComputerNameEx Failed with Error Code"<<GetLastError();
			return false;
		}
	}
	char* test = new char[1024*1024];
	wstrCompName.assign(pwszCompName);

	if(test)
	{
		delete[] test;
		test = NULL;
	}
	if(pwszCompName)
	{
		delete [] pwszCompName;
		pwszCompName = NULL;
	}
	return true;
}
Summary
In the above example we observed growth in private bytes. This eventually increases Virtual Bytes after it crosses 4KB limit (on 32bit OS).
Similarly we can also monitor Thread Count and Handle Count and fix them in a similar way.
This is just a very basic way to figure out using Perfmon, but this is very effective. I have used this many times in my career and was able to
nail down and fix the issue. Some other tools that can be used are DebugDiag & UMDH -- these are free tools from Microsoft.
Using CRT APIs is another technique which will be discussed in the next article.
References
History
- 2014-02-10: Article upload
A Technology Enthusiast since 14 Years, have been contributing in varied Domains. Interested in developing technology which goes more meaning to Human Life, Nature and the entire ecosystem.
#Developer, #Architect, #Enthusiast, #Contributor #Mentor
To all Developers out there, You touch a Billion Lives a Billion Times
Before you code Think Twice !!!


 General
  News
News  Suggestion
  Question
  Bug
Bug  Answer
  Joke
Joke  Praise
  Rant
Rant  Admin
Admin 


