Not so long ago, Microsoft has made .NET source code browsable through a really nice page: http://referencesource.microsoft.com/. Additionally, they promised that the .NET Framework source code debugging will finally work in Visual Studio. At almost the same time, JetBrains published EAP of its dotPeek tool with some great features that make “reverse-engineered debugging” extremely easy. And for other DLLs, we still have the old Microsoft Public Symbols server. In this post, I am going to show you how I configure my system and Visual Studio for different debugging scenarios.
I will start with some basic information on how symbol files are found and loaded. Most debuggers and diagnostics applications use dbghelp.dll library (provided by Microsoft) to load PDB files. Locations which are examined in order to find PDB files are as follows (keep in mind that the PDB file name must match the DLL file name):
- The application folder (where the .exe file is located)
- The folder from which the DLL file was loaded (for .NET assemblies, it might be for example GAC)
- C:\WINDOWS\
- C:\WINDOWS\symbols\dll\
- C:\WINDOWS\dll
- Locations pointed by the
_NT_SYMBOL_PATH system variable (you can find more information about this variable here) - Other locations configured in the debugger
It is worth to have the _NT_SYMBOL_PATH variable set in the system as it is read not only by debuggers but also by tools from Windows Performance Toolkit or sysinternals applications. I have a script which I run on a fresh Windows installation which sets this variable for me:
@echo Setting _NT_SYMBOL_PATH...

@setx /M _NT_SYMBOL_PATH SRV*C:\symbols\dbg*http://referencesource.microsoft.com/symbols;SRV*C:\symbols\dbg*http://msdl.microsoft.com/download/symbols

@echo Setting _NT_SYMCACHE_PATH...

@setx /M _NT_SYMCACHE_PATH c:\symbols\xperf

:: and for the current session also
@set "_NT_SYMBOL_PATH=SRV*C:\symbols\dbg*http://referencesource.microsoft.com/symbols;SRV*C:\symbols\dbg*http://msdl.microsoft.com/download/symbols"

@set "_NT_SYMCACHE_PATH=c:\symbols\xperf"
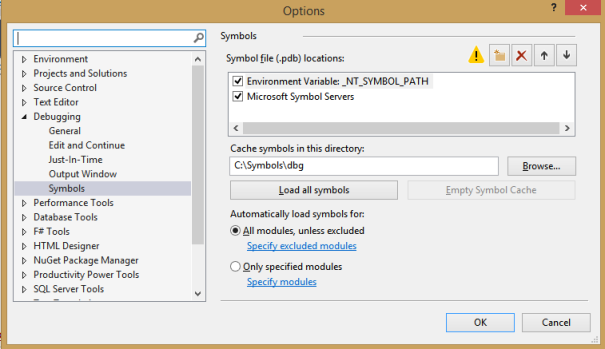
_NT_SYMCACHE_PATH, which appears in the above script, is another system variable which points to a symbols cache used by profilers from Windows Performance Toolkit. Visual Studio is aware of the _NT_SYMBOLS_PATH variable which is visible in the debugging options pane:
Let’s now examine different debugging scenarios when you would like to adjust symbols loading settings.
Debugging My Application Code
It is quite common while debugging that you are not interested in assemblies which do not belong to your application and you don’t have time to wait till symbol files for all the modules get loaded. Visual Studio team has thought of this scenario and provided you with an option Enable just My Code in the debugger settings:
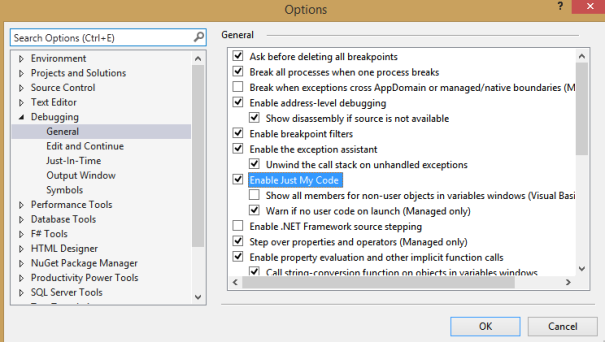
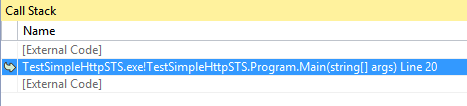
Keep in mind though that setting this checkbox will make your debugger skip loading symbols for .NET Framework assemblies (and some external libraries) and in case of an exception, the call stack window won’t show you the exact location where the exception was thrown:
Debugging .NET Framework Source Code
In times when you would like to step through the .NET Framework code, you need to change few settings in the Visual Studio debugger as it is explained here. Unfortunately, updates to .NET Framework often break this functionality. In case a symbol file was not loaded for an assembly, you can verify which locations Visual Studio has checked – just right click on the module and choose Symbol Load Information… in the Modules dialog (Debug->Windows->Modules). The output will be similar to the one below:
D:\Users\...\bin\Debug\System.IdentityModel.pdb: Cannot find or open the PDB file.
C:\WINDOWS\Microsoft.Net\assembly\GAC_MSIL\System.IdentityModel\v4.0_4.0.0.0__b77a5c561934e089\System.IdentityModel.pdb: Cannot find or open the PDB file.
C:\WINDOWS\System.IdentityModel.pdb: Cannot find or open the PDB file.
C:\WINDOWS\symbols\dll\System.IdentityModel.pdb: Cannot find or open the PDB file.
C:\WINDOWS\dll\System.IdentityModel.pdb: Cannot find or open the PDB file.
C:\Symbols\dbg\System.IdentityModel.pdb\be517440cdd24a25b0fad1eefd33553b1\System.IdentityModel.pdb: Cannot find or open the PDB file.
C:\Symbols\dbg\MicrosoftPublicSymbols\System.IdentityModel.pdb\be517440cdd24a25b0fad1eefd33553b1\System.IdentityModel.pdb: Cannot find or open the PDB file.
SYMSRV:  C:\symbols\dbg\System.IdentityModel.pdb\BE517440CDD24A25B0FAD1EEFD33553B1\System.IdentityModel.pdb not found
SYMSRV:  http://referencesource.microsoft.com/symbols/System.IdentityModel.pdb/BE517440CDD24A25B0FAD1EEFD33553B1/System.IdentityModel.pdb not found
SRV*C:\symbols\dbg*http://referencesource.microsoft.com/symbols: Symbols not found on symbol server.
SYMSRV:  C:\symbols\dbg\System.IdentityModel.pdb\BE517440CDD24A25B0FAD1EEFD33553B1\System.IdentityModel.pdb not found
SYMSRV:  http://msdl.microsoft.com/download/symbols/System.IdentityModel.pdb/BE517440CDD24A25B0FAD1EEFD33553B1/System.IdentityModel.pdb not found
SRV*C:\symbols\dbg*http://msdl.microsoft.com/download/symbols: Symbols not found on symbol server.
SYMSRV:  C:\Symbols\dbg\System.IdentityModel.pdb\BE517440CDD24A25B0FAD1EEFD33553B1\System.IdentityModel.pdb not found
SYMSRV:  http://msdl.microsoft.com/download/symbols/System.IdentityModel.pdb/BE517440CDD24A25B0FAD1EEFD33553B1/System.IdentityModel.pdb not found
http://msdl.microsoft.com/download/symbols: Symbols not found on symbol server.
As you can see, when I was debugging my application, Visual Studio wasn’t able to find the System.IdentityModel.pdb file in Microsoft symbol servers. Fortunately, thanks to dotPeek, you still can fix this situation – I will show you how in the next paragraph.
Debugging External Assemblies
Here we will deal with a situation when we don’t have valid PDB files for our modules but still would like to debug source code of the external library (or .NET Framework assembly if default settings do not work). First, go and grab EAP version of dotPeek. Run it and open the Options window. Go to Symbol Server and check Assemblies opened in the Assembly Explorer:
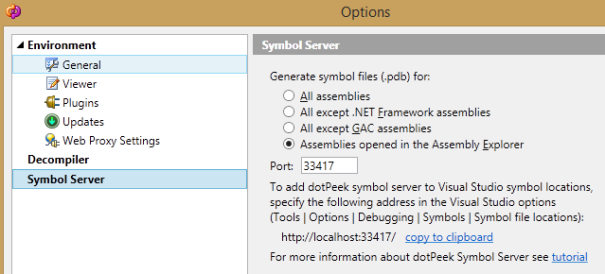
Other options are also cool but usually will slow down your debugger considerably. Now drag assemblies you would like to debug into the Assembly Explorer and press Start Symbol Server button in the toolbar. It’s time to make use of our brand new Symbol Server in Visual Studio. If you haven’t set the _NT_SYMBOL_PATH variable in your system, you just need to add http://localhost:33417 to the symbol file locations in the debugger options and uncheck “Microsoft Symbol Servers” (otherwise you will get public symbols from Microsoft for .NET assemblies):
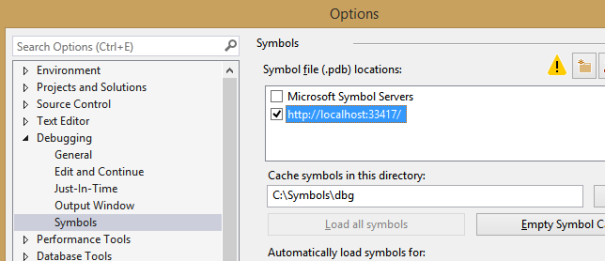
If you have set the _NT_SYMBOL_PATH, you will need to modify it by adding SRV*http://localhost:33417; at the beginning so this location is searched as the first one and no symbol caching is applied. Also remember to Empty the symbols cache. If Visual Studio finds a PDB file in it, your symbols server will never be called.
Visual Studio Plugin
I wrote a very simple VS plugin – first in my life. If you decide to install it, it will be probably the ugliest one you have :). It contains just four buttons which will switch your symbols settings to one of the previously mentioned configurations. The plugin looks as follows:
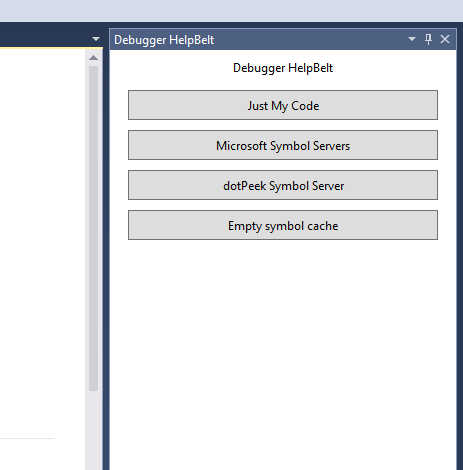
If you are not scared, you can grab it from here. Unfortunately, when you would like to switch from MS symbols to dotPeek and vice versa, you need to do this when the debugger is not running. I also observed that the debugger engine sometimes switches to new settings on a second run – don’t know whether it’s my fault or a bug in Visual Studio.
Whether you manually configure symbols or use my hardcore plugin, I wish you happy resolving. :)
Filed under: CodeProject, PDB files usage 


 General
  News
News  Suggestion
  Question
  Bug
Bug  Answer
  Joke
Joke  Praise
  Rant
Rant  Admin
Admin 


