This article provides a full demo application using both the C# and R programming languages interchangeably to rapidly identify and cluster similar images. The demo application includes a directory with 687 screenshots of webpages.
Abstract
This article provides a full demo application using both the C# and R programming languages interchangeably to rapidly identify and cluster similar images. The demo application includes a directory with 687 screenshots of webpages. Many of these images are very similar with different domain names but near identical content. Some images are only slightly similar with the sites using the same general layouts but different colors and different images on certain portions of the page. The demo application can create a pairwise distance matrix including measures of dissimilarity between all 687 websites in around 67 seconds on my laptop. Next, the R programming language is used to perform Hierarchical Agglomerative Clustering grouping all similar images together in the same clusters. The application demonstrates how to create very tight, highly similar clusters or larger, very loose, slightly dissimilar clusters by adjusting the clustering cut height. After reviewing this article and the included demo project code, the reader should be able to identify similar images and weave together high-performance processing pipelines using inputs and outputs from both the C# and R programming languages.
Here is a screenshot of the demo application displaying the first four similar images from cluster 7:
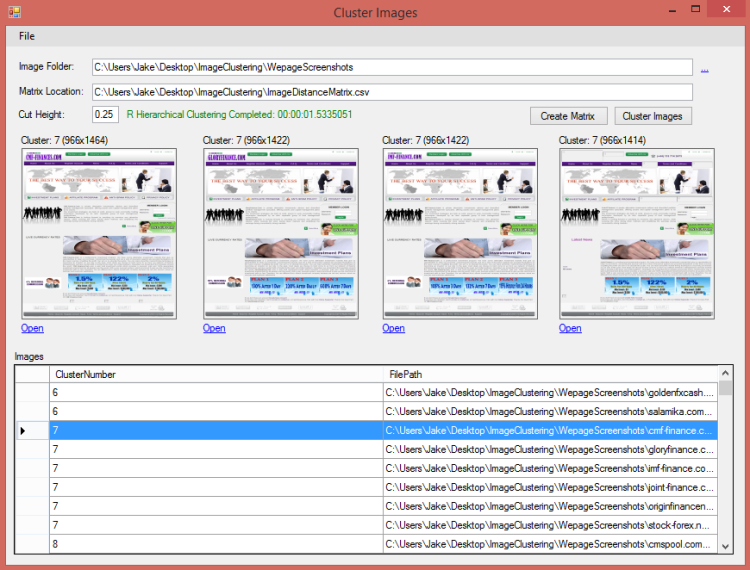
Cluster images are displayed as they are selected by the user.
Introduction
While the C# programming language is “a multi-paradigm programming language encompassing strong typing, imperative, declarative, functional, generic, object-oriented (class-based), and component-oriented programming disciplines”, [1] R is an open source functional programming language [2] which has become very popular for more complex statistical data analysis. Typically, these two programming languages are seldom used together. There have been attempts to successfully integrate R and C# within the same process using R.NET. [3] However, this project is relatively unused with around 93 downloads on its homepage as of today.
One of the primary advantages for using R is the large number of “packages” contributed by users across the globe which can be quickly integrated into any R project for added programming features and functionality. C#, on the other hand, has some extensive built in libraries for rapid parallel programming development which are simply hard to surpass. I was recently excited to discover that the standard R installation includes a program called Rscript.exe which can be used from the command line to execute R programming code contained within a file. After a little experimenting, I was able to write a small class within C# which will execute any R program file using Rscript.exe. In fact, you can even pass variables back and forth between the two languages interchangeably within a single processing pipeline.
By the end of this article, the reader can expect to understand the following concepts:
- Executing R programming code from within a C# program.
- Passing variables and information between C# and R programs.
- Extracting luminosity histogram features from images using C#.
- Comparing two image’s luminosity histograms to measure image similarity.
- Executing steps 4 and 5 in parallel using C#
MapReduce style processing to create a pairwise distance matrix from a large collection of images. - Performing Hierarchical Agglomerative Clustering using the R programming language to cluster similar images together using input from the pairwise distance matrix.
- Understanding the impact to the clusters created when changing the cut height parameter during Hierarchical Agglomerative Clustering.
This may sound like a lot of material to cover. However, all of the code and clustering results can be reviewed using the fully functional demo application and sample images which are included in the Resources section below. The demo application was written in C# using Visual Studio 2013 and requires a full installation of the R programming language to work properly.
Executing R Programming Code From Within a C# Program
The RScriptRunner class executes R programs from C# using the Rscript.exe program which comes with the standard R installation. This class simply starts Rscript.exe in the background and then passes it any number of command line arguments which can be accessed and used within the R program.
The C# code starts the Rscript.exe program as a separate process and redirects the R standard output to a string variable which is returned to C# when the R program completes:

Figure 1 – Run an R program from C#
The only cumbersome part of using the RScriptRunner‘s RunFromCmd() function is making sure that you provide the correct location for the Rscript.exe program. On my machine, this was as simple as providing the value Rscript.exe. However, on other computers, where Rscript.exe is not recognized as a valid command line command (i.e., a proper path / environment variable was not set), this argument may require a fully qualified path for the “Rscript.exe” program. My best advice would be to figure out what is required to enter in the command line window to start Rscript.exe and then use that value.
The following C# code snippet executes the R program ImageClustering.r using the RscriptRunner.RunFromCmd() function:
Figure 2 – Run R code from C# and then use the results.
Prior to execution of the RscriptRunner.RunFromCmd() function, the three variables workingDirectory, clusteringOutput, and cutHeight are separated by spaces and passed in as arguments to the function. Once these arguments are passed to Rscript.exe, they can be accessed directly from within the ImageClustering.r program.
Figure 3 demonstrates how each variable is captured in the ImageClustering.r program, and then how the first argument is used to set the working directory within R:
Figure 3 – Using a C# variable in an R program.
Since the output file location for the ImageClustering.r program was actually provided by C# as the variable clusteringOutput in Figure 2, the C# program can easily begin to process the output created by the R clustering program when the RscriptRunner.RunFromCmd() function call completes. The last foreach() loop in Figure 2 demonstrates C# reading in the clustering assignments created by the ImageClustering.r program.
Extracting Luminosity Histogram Features from Images Using C#
“Luminance is a photometric measure of the luminous intensity per unit area of light” which “describes the amount of light that passes through or is emitted from a particular area, and falls within a given solid angle.” [4] Relative luminance follows this definition, but it normalizes its values to 1 or 100 for a reference white. [5] When separated into RGB components, a luminosity histogram acts as a very powerful machine learning fingerprint for an image. Since these type of histograms only evaluate the distribution and occurrence of luminosity color information, they can handle affine transformations quite well. [6] In simple terms, it's very easy to separate the RGB components of an image using C#. In fact, using the “unsafe” keyword you can very, very rapidly calculate the relative luminance of each pixel within an image. I am certainly not the first person to think of doing this in C# either. There are several C# Computer Vision pioneers who deserve some credit in this regard. [7,8]. For this project, I was able to quickly adapt the luminosity histogram feature extraction program contained within the Eye.Open library.[8]
The following figure demonstrates how a image luminosity histogram can quickly be calculated using C#:
Figure 4 – Use RGB channels from image to calculate luminosity for each pixel.
Once an image has been processed, both vertical and horizontal luminosity histograms are extracted and retained for similarity calculations between images. Figure 4 shows each pixel’s red, green, and blue channels being isolated for use within the luminosity calculation. Images can quickly be compared for similarity using the similarity function shown in Figure 5 which calculates the deviation between two histograms using the weighted mean. Once both the vertical and horizontal similarity have been calculated, the maximum or average vertical / horizontal similarity is retained for each image pair to create the pairwise image distance matrix.
Figure 5 demonstrates how similarity can be measured between two luminosity histograms:
Figure 5 – Luminosity Histogram Similarity Function
Keep in mind that there are many ways to extract features from images and create image fingerprints. Many people recommend other approaches such as taking 2d Harr Wavelets of each image. [9] In addition, higher performance options such as using minhashing with tf-idf weighting have also been implemented[10]. Harr features have been successfully used for more complex Computer Vision tasks such as detecting faces within an image[11]. However, the speed and performance of luminosity histograms are hard to ignore, if the recognition quality meets your requirements. Other image feature engine implementations in C# such as CEDD: Color and Edge Directivity Descriptors [12], FCTH: Fuzzy Color and Texture Histograms [13], a hybrid scheme using NMRR and ANMRR values [14], and LIRe: Lucene Image Retrieval [15] can be located within the C# application provided here [7].
Using MapReduce Style Processing to Extract and Compare Image Fingerprints in Parallel
A parallel pipeline within the demo project is used to “map” images into luminosity histograms while simultaneously “reducing” luminosity histograms into a pairwise distance matrix. For those of you wondering, a pairwise distance matrix is simply a matrix that contains a measure of dissimilarity for all possible pairs of images considered. Dissimilarity for a pair of images is calculated as 1 – the Similarity between both images. The distance matrix will always contain (n^2 – n ) / 2 meaningful entries where n equals the total number of unique items in the matrix. This is due to the fact that all items will intersect with themselves down the center diagonal, and all values on either side of the diagonal are duplicated and only need to be stored one time.
Figure 6 further demonstrates this concept:
Figure 6 – Only the information below the diagonal is required.
The pairwise distance matrix is required as input when using the Hierarchical Agglomerative Clustering function within R. In order to create this matrix in parallel, a three stage parallel pipeline is used. First, pairwise image matches are created using a C# yield return enumeration. Each time the generateMatches() function in Figure 7 produces a pairwise match, processing stops and “yield returns” each match to the createPairwiseMatches() function’s Parallel.ForEach loop.
Figure 7 shows the relationship between these two functions which is executed in a background process during the distance matrix creation:
Figure 7 – The MapReduce Mapping Stage.
The createPairwiseMatches() function shown in Figure 7 above, extracts features in parallel mapping images to vertical and horizontal luminosity histograms. Furthermore, the histograms for each image are saved in a hash table for quick reference since each image’s features will be repeatedly matched to other images. Once the match features are extracted, the match is immediately placed in a thread safe blocking collection for further downstream reduction processing. While the mapping functions shown in Figure 7 are executing in a background thread, parallel reduce functions simultaneously execute processing each completed match produced to calculate the similarity between the match images.
Figure 8 shows the calculateDistances() function reducing image features into a single similarity measure:
Figure 8 – MapReduce Reduction Stage.
Once this process has completed, a pairwise distance matrix is saved to disk which can be used as input into the R program’s Hierarchical Agglomerative Clustering engine. Similar to Figure 6 above, the final distance matrix contains pairwise distances for all images in the input directory.
Figure 9 demonstrates that only the minimum required number of pairwise distances were retained:
Figure 9 – The Pairwise Distance Matrix.
Hierarchical Agglomerative Clustering in R
While there are multitudes of packages and options for clustering data within R, the base language provides functions for simple HAC clustering. The purpose of this article is not to explain in too much detail how HAC clustering works. Rather, a demonstration of how HAC clustering can be used to identify similar images is provided.
The purpose of clustering is to divide a collection of items into groups based on their similarity to each other. Very simplistically… The HAC clustering of images works by comparing the pairwise distances of all images and then grouping them into a structure called a dendrogram. The “dendrogram” is a map of all possible clustering assignments at various dissimilarity thresholds. The dissimilarity threshold dictates the maximum amount two images (or two clusters of images) are allowed to be dissimilar and still end up being merged into the same cluster. Once the dendrogram has been created, all images can quickly be assigned to clusters using any dissimilarity threshold value, which is referred to as the “cut height”. The cut height is typically provided by the user. This process can also occur in reverse with the user requesting a particular total number of clusters at which point the algorithm calculates the best cut height to achieve the requested result. While a small cut height will produce smaller clusters with highly similar images, a large cut height will create larger clusters containing more dissimilar images.
What this all means is that the dendrogram maps out all possible clustering memberships based on each image’s dissimilarity to the cluster as a group. This can be done using each cluster’s minimum, maximum, average, or centroid distances. Depending on what measure you choose to use, the clustering type is referred to by “nerds” as either single-linkage (minimum), complete-linkage (maximum), UPGMA (Unweighted Pair Group Method with Arithmetic Mean) (average), or centroid-based (centroid) clustering. While there are many types of clustering methods, these seem to be the most common.
The clustering algorithms typically work by starting out with all images in their own individual cluster of 1, and then successively combining the clusters which are in closest distance proximity based on the distance metrics described above. The clusters are combined until no more clusters can be joined without violating the provided cut height threshold. While this description is a slight over-simplification, additional research regarding this topic is left up to the reader.
Figure 10 shows a dendrogram with all possible clustering combinations for 40 images at various cut heights which are displayed along the y axis:
Figure 10 – A Dendrogram for 40 Images.
Looking at the dendrogram in Figure 10 above, it is easy to see that a cut height of 0.60 would produce only two clusters containing all 40 images. In this case, the two clusters are very large and likely contain many dissimilar images since the cut height threshold allows images with a distance of up to 0.60 to be included within the same cluster. In the other extreme, a cut height of 0.10 places all but 2 images into singleton clusters containing only one image each. This is due to the fact that images must be at least 90% similar to be included within the same cluster. Using the demo application, the cut height can be adjusted to explore the impact on clustering similar images.
Figure 11 illustrates how image clusters are changed by a 10% adjustment in cut height when using the demo application’s sample images:
Figure 11 – Cut Height Impact on Clusters
Figure 11 shows a 10% reduction in cut height forcing the third image out of the cluster. Since two of the images are highly similar, they remain in a cluster of 2 once the cut height dissimilarity threshold is reduced to 0.25. It is important to understand that the optimal cut height for image clustering will vary greatly depending on the types of images you are trying to cluster and the image features used to create the pairwise image distance matrix. Even within the sample images provided, strong arguments can made for adjustments in the cut height depending on individual goals.
For instance, Figure 12 shows four images included in a single cluster. However, some might argue that one of these images is sufficiently different than the other three:
Figure 12 – Cut Height Impact on Cluster Similarity.
Conversely, if one were trying to identify websites made from the same template, all of the images above would be clustered acceptably. In fact, you would even want these images to be included in the same cluster, if they had different color schemes. In this instance, a more generous cut height might be applied, and in some cases, different features might be required for the image matching exercise at hand.
Once the distance matrix has been created, it is relatively straightforward to perform the clustering using R. The R program used to perform Hierarchical Agglomerative Clustering on the image distance matrix can be seen in Figure 13 below:
Figure 13 – HAC Clustering Using R.
Once the image distance matrix is saved to disk using C#, the ImageClustering.r program reads in the file and converts it to an R distance matrix (dist) object. Next, the function hclust() creates the dendrogram mapping using the UPGMA or “average” distance method. The cutree() function then cuts the dendrogram to the cutHeight which is specified by the user. It is important to note that this value was actually specified by the user on the demo application’s form. This value can be seen being passed as an argument from C# to the RscriptRunner’s RunFromCmd() function in Figure 2. It is also seen being captured within the ImageClustering.r program in Figure 3. The R clustering program is very efficient clustering the 687 images in just over 1 second on my machine. Finally, the file names are sorted by cluster number and written back to disk.
Conclusion
This article successfully demonstrates that the C# and R programming languages can be combined to create powerful parallel processing pipelines using MapReduce style programming and harnessing the analytical powers of R as needed. Information produced in both R and C# can also easily be exchanged and combined across programs when necessary. The demo application provided in the Resources section below uses the powerful parallel programming libraries in C# to rapidly extract and compare luminosity histograms from images creating a pairwise distance matrix for all images contained in a directory folder. Next, C# uses R to perform HAC clustering to combine similar images and then display the output from R on demo application’s form. The demo application gives the user a thumbnail preview of the currently selected image row and also the next three images below the currently selected image. This allows the user to change the clustering cut height and quickly re-run the R clustering program until they are satisfied with the image clustering results.
Article Resources
- Feel free to learn more about me at: www.jakemdrew.com
- The demo application, screenshot images, and source code presented within this article are available for review on the web and can be downloaded using the links below.
View Code on the Web (html)
- ImageClustering.r - The R program for HAC clustering using an image distance matrix
- RScriptRunner – C# class used for executing R programs from C#
- ImageDistanceMatrix - C# class which creates a pairwise distance matrix for all images in a folder
- RgbProjector – C# Adaptation of the
Eye.Open project’s code used for extracting luminosity histograms from images and comparing them for similarity
Demo Application Downloads (zip file)
- ImageClusteringSmall.zip - The entire image clustering Visual Studio project including all source code, 40 webpage screen shots, and distance matrix / clustering outputs for the sample images. (42,068 KB)
- ImageClusteringAll.zip - The entire image clustering Visual Studio project including all source code, 687 webpage screen shots, and distance matrix / clustering outputs for the sample images. Warning!!! (210,432 KB)
- ImageClustering.zip - The image clustering Visual Studio class library project including the RScriptRunner, ImageDistanceMatrix, and RgbProjector source and no demo application or images. (42 kb)
- ImageClusteringApp.zip - The image clustering Visual Studio class library and demo app with NO SCREENSHOTS (232 KB)
References
- Wikipedia, C#, http://en.wikipedia.org/wiki/C_Sharp_(programming_language), accessed on 06/24/2014
- Advanced R, Hadley Wickham, http://adv-r.had.co.nz/Functional-programming.html, accessed on 06/24/2014
- CodePlex, R.NET, https://rdotnet.codeplex.com/, accessed on 06/24/2014
- Wikipedia, Luminance, http://en.wikipedia.org/wiki/Luminance, accessed on 06/24/2014
- Wikipedia, Relative Luminance, http://en.wikipedia.org/wiki/Luminance_(relative)#cite_note-1, accessed on 06/24/2014
- Stack Overflow, Image Fingerprint, http://stackoverflow.com/questions/596262/image-fingerprint-to-compare-similarity-of-many-images
- AI Applications, C# Tutorials, http://savvash.blogspot.com/p/c-tutorials.html, accessed on 06/24/2014
- CodePlex, Similar Images Finder, https://similarimagesfinder.codeplex.com/, accessed on 06/24/2014
- Stack Overflow, Near-Duplicate Image Detection, http://stackoverflow.com/questions/1034900/near-duplicate-image-detection/1076507#1076507, accessed on 06/24/2014
- Chum et. al., Near Duplicate Image Detection: min-Hash and tf-idf Weighting, http://cmp.felk.cvut.cz/~chum/papers/chum_bmvc08.pdf, accessed on 06/24/2014
- CodeProject, Haar-feature Object Detection in C#, http://www.codeproject.com/Articles/441226/Haar-feature-Object-Detection-in-Csharp, accessed on 06/24/2014
- Savvas et. al., CEDD: Color and Edge Directivity Descriptors, http://orpheus.ee.duth.gr/anaktisi/pdfs/CEDD.pdf, accessed on 06/24/2014
- Savvas et. al., FCTH: Fuzzy Color and Texture Histogram, http://orpheus.ee.duth.gr/anaktisi/pdfs/FCTH.pdf, accessed on 06/24/2014
- Savvas et. al., A Hybrid Scheme for Fast and Accurate Image Retrieval based on Color Descriptors,http://www.actapress.com/Abstract.aspx?paperId=31620, accessed on 06/24/2014
- Mathias et. al., Lire: lucene image retrieval: an extensible Java cbir library, http://www.researchgate.net/publication/221573372_Lire_lucene_image_retrieval_an_extensible_java_CBIR_library/file/3deec526a1ca298d98.pdf, accessed on 06/24/2014


 General
  News
News  Suggestion
  Question
  Bug
Bug  Answer
  Joke
Joke  Praise
  Rant
Rant  Admin
Admin 


