Introduction
Compressed sensing (CS) is a relatively new technique in the signal processing field which allows acquiring signals while taking few samples. It works for sparse signals and has a few restrictions which we will get into.
For those familiar with the Nyquist rate, it states that in order to obtain all relevant information in a signal, the sampling rate must be at least 2 times the bandwidth of the signal. Consider a signal that is the sum of several signals (perhaps simple sinusoids), where the highest frequency sinusoid is 50 Hz. In order to capture all of the relevant information, it must be sampled at or above 100 Hz. For a deeper explanation, see below. The purpose of compressed sensing is to allow us to obtain fewer than the previously required amount of samples while still perfectly (or nearly perfectly) recovering the signal.
http://en.wikipedia.org/wiki/Compressed_sensing
http://en.wikipedia.org/wiki/Nyquist_rate
Background
When I first heard about "compressed sensing" I found it very interesting but definitely didn't have a solid grasp. I am writing this article in order to not only enlighten others on CS but to build my own understanding of it. Here are a few areas of which prior knowledge may be useful:
Linear Algebra/Matrix Algebra
Since we will be using Matlab, linear algebra is always useful, particularly the way matrices are treated. It's important to know the difference between ' and .' as well as * and .* (for a refresher check out Matlab's own refresher page).
Signal Processing Basics
Also useful to have would be some knowledge of signal processing, such as a basic grasp of the Fourier Transform and the Nyquist rate (see Intro). The data we will be observing may represent simple time-domain signals, but it is important to understand what a transformation is since that is at the heart of CS.
Compression Techniques (JPEG)
This is a bit more advanced and perhaps not necessary to understand initially. However, if you've ever looked into how images and files on computers are made to be so small you've probably run into compression before. For image compression, JPEG is an old and common standard. JPEG uses a technique called the Discrete Cosine Transform (DCT). Later a different version was created called JPEG2000, which uses the Wavelet Transform. These transformations make up some of the more advanced methods which we will get into.
Sparsity
Sparsity is a common term in compressed sensing. In the mathematical sense, a sparse collection of data has a small number of non-zero values. To put it simply, most values are 0 and only a few contain meaningful data. Check out the entry on sparse matrices.
Basic Math behind Compressed Sensing
It's time to jump into a bit of the mathematics behind CS. I will try to use some of the notation that's common in the literature that I've seen so if you decide to read up on it you won't be thrown for as big of a loop.
Imagine we have a signal x, which represents a time-domain signal of length N. In a perfect world, we would simply take N measurements and call it a day! However, today we can only take K measurements (K < N).
We use a vector y to represent our K measurements. What's important to note is that one measurement doesn't necessarily correspond to a single input value. This may seem confusing at first, but in real-life systems measurements aren't always made in a single-file, linear fashion.
In order to get to y, we use A. Put simply: y = Ax.
A is the sensing matrix, which allows us to get from x to y (via random measurements1, transformations, or a combination of the two).
To summarize, we have the following:
- x - N×1 vector representing our original signal (must be somehow compressible)
- y - K×1 vector of our output values
- A - K×N sensing matrix (how we get from input to output)
Exercise 1:
Imagine x is of length N=8 and has random values. We want to keep only 3 of them (let's say the 1st, 2nd, and 5th). Here's what the linear algebra would look like in terms of y = Ax.
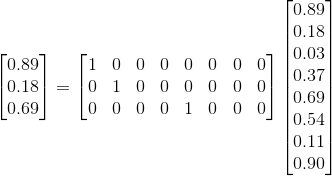
Fig. 1: Simple exercise in linear algebra.
In Figure 1, we are clearly keeping 3 samples of our original values and throwing away the other 5. If x is a sparse signal (only a few useful values) then we can't afford to randomly keep a few values, or else we might lose the ones we need! This is because we don't know the location of the useful values beforehand.

Fig. 2: If we randomly select values from our sparse signal, we lose some information!
We need a different approach so we don't lose our non-zero values! Fortunately for us, if we use Gaussian random variables as our sensing matrix A, we won't lose our data. It won't look the same for now, but it's still encoded in our output.
Fig. 3: Obtaining only 3 output values in a different manner - random measurements.
In the system represented by Figure 3, we have some knowns, some unknowns, and some assumptions:
Known:
- The 3×8 sensing matrix A (it may be randomly generated, but we generated it)
- The 3×1 resulting output vector y
Unknown:
Assumptions:
- The 8×1 vector x is sparse (if it's not sparse, what we're doing won't work)
With the above knowledge, how do we know figure out what x is? That's where the compressed sensing recovery methods come in. A popular method is the ℓ1-MAGIC algorithm suite [1], which centers on L1-norm minimization2 and is beyond the scope of this article. It is an iterative process which relies on multiple parameters but the conditions above are a good start to meeting the algorithm's requirements.
Matlab Code
Note that you must have the l1magic code folder from [1] in order to run these examples. I suggest downloading the code and placing it in the same directory you use for the following example. (Unfortunately there's no code template for Matlab here so you get monochrome text).
IMPORTANT
You need to change line 141 of the file "l1eq_pd.m" to avoid errors. This line originally reads as follows:
[dv,hcond] = linsolve(H11p, w1p, opts);
Instead we want to make it the following:
[dv,hcond] = linsolve(H11p, w1p);
I suggest you simply comment out line 141 and add the corrected line below it.
Example 1: A sparse time-domain signal
% Initialize constants and variables
rng(0);                 % set RNG seed
N = 256;                % length of signal
P = 5;                  % number of non-zero peaks
K = 64;                 % number of measurements to take (N < L)
x = zeros(N,1);         % original signal (P-sparse)

% Generate signal with P randomly spread values
peaks = randperm(N);
peaks = peaks(1:P);
x(peaks) = randn(1, P);
amp = 1.2*max(abs(x));
figure; subplot(3,1,1); plot(x); title('Original signal'); xlim([1 N]); ylim([-amp amp]);

% Obtain K measurements
A = randn(K, N);
y = A*x;
subplot(3,1,2); plot(y); title('K measured values'); xlim([1 K]);

% Perform Compressed Sensing recovery
x0 = A.'*y;
xp = l1eq_pd(x0, A, [], y);
subplot(3,1,3); plot(real(xp)); title('Recovered signal'); xlim([1 N]); ylim([-amp amp]);
The original signal had 256 values but we recovered it perfectly even though we only took 64 random measurements!
As you can see, compressed sensing worked for this simple example. I recommend experimenting with it to see if the results change. For example, what happens if we take fewer measurements? Try it out by reducing K to 32 or 16 and see what happens.
More Compressed Sensing Math
Sometimes the signal we are interested in isn't sparse in the domain we've measured it in. For example, consider a signal composed of a small number of sinusoids. In the time domain the function sin(2πt) is not sparse. However, if we observe it in the frequency domain, it is fully represented by only two peaks3.
In order to perform recovery in the sparse domain, we must explicitly implement it this way. In order to do so, it is important to understand the two orthonormal bases (or orthobases) which are critical for CS.
Understanding the orthobases in CS
Ψ - Representation basis
As mentioned several times already, our signal must be sparse in order to perform compressed sensing. The representation basis Ψ is the mathematical way of getting the signal into a sparse domain.
In Example 1, the time-domain signal was already in its sparse domain. Hence, Ψ was simply the identity matrix IN, and could be excluded from in the algebra steps. However, in Example 2 below, we will have a time-domain signal that is sparse in a different domain (the frequency domain in this case). Therefore, Ψ will be the basis which transforms a time-domain signal into the frequency domain, i.e. the DFT matrix.
As explained in [2], there are many possibilities for Ψ, and picking the right one is dependent on the application at hand. For frequency-sparse signals, the DFT is applicable. For 2-D images, however, one of the many Wavelet transform bases may be applicable.
Φ - Sensing basis
The sensing basis Φ represents the domain from which we extract values from the signal. In Example 1, this was simply the matrix of random Gaussian entries. In Example 2 below, this will be spikes. As you can see, this describes the method used to obtain a smaller (compressed) amount of data. In Examples 1 and 2, this operation appears in two steps:
- Create a random permutation with N values. (There are two
randperms in Example 2, be sure to locate the correct one). - Grab the first K values, ensuring we've obtained K subsets of Φ at random.
Additional information
We have been treating our resulting K×N matrix (e.g. A from Exercise 1) as the sensing basis for simplicity. However, to be precise, the sensing basis is actually the complete N×N matrix, and an additional matrix R is used to extract the K entries from Φ. The extraction matrix is obtained by simply keeping K rows from IN.
Thus, the sensing matrix in its complete form is A = RΦΨ.
The effect this has on our code is that the recovered data will not be in our original domain. It's in the compressed domain, and thus must be "uncompressed" by multiplying it by Ψ-1. This returns the data to the desired domain.
Matlab Code (cont.)
Example 2: A sparse frequency-domain signal
A few notes before the code:
You can easily perform this same example by generating a set number of spikes in the frequency domain instead of generating time-domain signals first. The advantage of the method below is that it makes it easier to use real-valued time domain signals to more accurately represent real-life signals.
Because Ψ is the DFT matrix in this case, its inverse is easily obtainable as conj(Ψ)/N (see dftmtx help page).
If you don't have Matlab's signal processing toolbox, you can replace dftmtx with similar algorithms (such as this one) or even write the algorithm yourself for practice! (similar to here but without the N-1/2 scaling factor)
% Initialize constants and variables
rng(0);                 % set RNG seed
N = 256;                % length of signal
P = 2;                  % number of sinusoids
K = 64;                 % number of measurements to take (N < L)

% Generate signal with P randomly spread sinosoids
% Note that a real-valued sinusoid has two peaks in the frequency domain
freq = randperm(N/2)-1;
freq = freq(1:P).';
n = 0:N-1;
x = sum(sin(2*pi*freq/N*n).', 2);

% Orthonormal basis matrix
Psi = dftmtx(N);
Psi_inv = conj(Psi)/N;
X = Psi*x;              % FFT of x(t)

% Plot signals
amp = 1.2*max(abs(x));
figure; subplot(5,1,1); plot(x); xlim([1 N]); ylim([-amp amp]);
title('$\mathbf{x(t)}$', 'Interpreter', 'latex')
subplot(5,1,2); plot(abs(X)); xlim([1 N]);
title('$|\mathbf{X(f)}|$', 'Interpreter', 'latex');

% Obtain K measurements
x_m = zeros(N,1);
q = randperm(N);
q = q(1:K);
x_m(q) = x(q);
subplot(5,1,3); plot(real(x_m)); xlim([1 N]);
title('Measured samples of $\mathbf{x(t)}$', 'Interpreter', 'latex');

A = Psi_inv(q, :);      % sensing matrix
y = A*X;                % measured values

% Perform Compressed Sensing recovery
x0 = A.'*y;
X_hat = l1eq_pd(x0, A, [], y, 1e-5);

subplot(5,1,4); plot(abs(X_hat)); xlim([1 N]);
title('$|\mathbf{\hat{X}(f)}|$', 'Interpreter', 'latex');

x_hat = real(Psi_inv*X_hat);    % IFFT of X_hat(f)

subplot(5,1,5); plot(x_hat); xlim([1 N]);  ylim([-amp amp]);
title('$\mathbf{\hat{x}(t)}$', 'Interpreter', 'latex');
Again, the original time-domain signal had 256 values. However, by taking only 64 individual values from it (25%) we were able to recover all 256 original values!
This differs from Example 1 in that the signal of interest was sparse not in the time domain, but in the frequency domain. This worked because the sensing basis (spikes) and the representative basis (DFT) are orthogonal to each other. As usual, I encourage you to experiment by changing some parameters, such as N, K, and P.
Points of Interest
The examples included herein have the random number generator (RNG) seeded with a predetermined value. This is so that you will have the same results as are shown. Feel free to change the seed value (currently 0) or comment the line out entirely to test using different random variables every time.
Matlab Help (F1) is your friend, so be sure to check it out when you need help understanding a function.
Don't forget to check your transpose operators carefully. When dealing with real-valued data, ' and .' are the same.
The conjugate transpose of [1 2 3] is [1 2 3]T which is the same as the transpose.
However, the conjugate transpose of [1i 2i 3i] becomes [-1i -2i -3i]T which is not the same as the transpose.
Footnotes
1 The "random measurements" actually don't have to be random. They can be predetermined seqeunces such as pseudo-random codes, noiselets, binary codes, etc. However, that is beyond the scope of this article for now.
2 http://mathworld.wolfram.com/L1-Norm.html
3 A complex sinusoid is a single peak in the frequency domain, but a real-valued sinusoid is equivalent to two complex sinusoids of frequency f and -f, thus it has two peaks in the frequency domain.
This is also contingent on the sampling frequency. If the sinusoid's frequency is not an integer multiple of 1/N, then the sinusoid will appear spread in the frequency domain and not have a single sharp peak (see related Matlab article).
History
V1: Intro, background, math, 1-D time-sparse example, 1-D frequency-sparse example.
Tentative future additions
- 2-D example.
- Recovery with noise added
References
- E. Candès and J. Romberg, ℓ1-MAGIC
URL: http://statweb.stanford.edu/~candes/l1magic/ - Candes, E.J.; Wakin, M.B., "An Introduction To Compressive Sampling," Signal Processing Magazine, IEEE, vol.25, no.2, pp.21,30, March 2008. doi: 10.1109/MSP.2007.914731
URL: http://ieeexplore.ieee.org/stamp/stamp.jsp?tp=&arnumber=4472240&isnumber=4472102 - Matlab Help Files. Mathworks, Cambridge MA. Accessed 2014.
URL: http://www.mathworks.com/help/matlab/
I am an electrical engineering student with a focus in signal processing. I'm always interested in learning new things about electronics and the technology that drives them.
If you have any questions/comments about something I've written please let me know, I always encourage feedback!


 General
  News
News  Suggestion
  Question
  Bug
Bug  Answer
  Joke
Joke  Praise
  Rant
Rant  Admin
Admin 


