Introduction
This article shows you how to create a line chart for web forms using C#. I think there are several third party components available for creating line chart and graphs. It wouldn't get you a knowledge on how internally it works. Hence I have created a line chart using GDI+ in C#. Besides this, you will be able to create a line chart in a quick manner.
Using the code
Below are the code for functions used to create the line chart:
Line2D.cs
Declaration section: declare these variables.
private int m_Width = 700;
private int m_Height = 400;
private ArrayList m_XAxis;
private ArrayList m_YAxis;
private Color m_graphColor = Color.Red;
private float m_XSlice = 1;
private float m_YSlice = 1;
private Graphics objGraphics;
private Bitmap objBitmap;
private string m_XAxisText = "X-Axis";
private string m_YAxisText = "Y-Axis";
private string m_Title = "Line Graph";
private Color m_TitleBackColor = Color.Cyan;
private Color m_TitleForeColor = Color.Green;
The next step is to create a property variable which facilitates the user to get or set values for the line chart.
public int Width
{
get { return m_Width;}
set
{
if ( value > 200)
m_Width = value;
}
}
public int Height
{
get { return m_Height;}
set
{
if ( value > 200)
m_Height = value;
}
}
public ArrayList XAxis
{
set
{
m_XAxis = value;
}
get { return m_XAxis;}
}
public ArrayList YAxis
{
set { m_YAxis = value;}
get { return m_YAxis;}
}
public Color GraphColor
{
set { m_graphColor = value;}
get { return m_graphColor;}
}
public float XSlice
{
set { m_XSlice = value;}
get { return m_XSlice;}
}
public float YSlice
{
set { m_YSlice = value;}
get { return m_YSlice;}
}
public string XAxisText
{
get { return m_XAxisText;}
set { m_XAxisText = value;}
}
public string YAxisText
{
get { return m_YAxisText;}
set { m_YAxisText = value;}
}
public string Title
{
get { return m_Title;}
set { m_Title = value;}
}
public Color TitleBackColor
{
get { return m_TitleBackColor;}
set { m_TitleBackColor = value;}
}
public Color TitleForeColor
{
get { return m_TitleForeColor;}
set { m_TitleForeColor = value;}
}
The above code snippet shows the following: creates Graphics object, initializes the Graph, draws rectangle region and fills the region, draws X-Axis line and Y-Axis line, draws Origin (0,0) point and sets Axis text and creates title.
public void InitializeGraph()
{
objBitmap = new Bitmap(Width,Height);
objGraphics = Graphics.FromImage(objBitmap);
objGraphics.FillRectangle(new SolidBrush(Color.LightGray),0,0,Width,Height);
objGraphics.DrawLine(new Pen(new SolidBrush(Color.Black),2),
100,Height - 100,Width - 100,Height - 100);
objGraphics.DrawLine(new Pen(new SolidBrush(Color.Black),2),
100,Height - 100,100,10);
objGraphics.DrawString("0",new Font("Courier New",10),
new SolidBrush(Color.White),100,Height - 90);
SetAxisText(ref objGraphics);
CreateTitle(ref objGraphics);
}
This function creates Graph by calling SetPixel function which draws the line in the rectangle region. Pass Color for the line Graph as input parameter.
public void CreateGraph(Color _GraphColor)
{
GraphColor = _GraphColor;
SetPixels(ref objGraphics);
}
This function gets the bitmap image of the graph drawn.
public Bitmap GetGraph()
{
SetXAxis(ref objGraphics,XSlice);
SetYAxis(ref objGraphics,YSlice);
return objBitmap;
}
This function draws the axis line for the Graph.
private void PlotGraph(ref Graphics objGraphics,
              float x1,float y1,float x2,float y2)
{
    objGraphics.DrawLine(new Pen(new SolidBrush(GraphColor),2),
        x1 + 100, (Height - 100) - y1 ,x2 + 100,(Height - 100) - y2  );
}
This function plots X and Y axis slices with given value ranges..
private  void SetXAxis(ref Graphics objGraphics,float iSlices)
{
    float x1 = 100,y1 = Height - 110,x2 = 100,y2 = Height - 90;
    int iCount = 0;
    int iSliceCount = 1;

    for(int iIndex = 0;iIndex <= Width - 200;iIndex += 10)
    {
        if(iCount == 5)
        {
            objGraphics.DrawLine(new Pen(new SolidBrush(Color.Black)),
                x1+iIndex,y1,x2+iIndex,y2);
            objGraphics.DrawString(Convert.ToString(iSlices * iSliceCount),
                new Font("verdana",8),new SolidBrush(Color.White),
                x1 + iIndex - 10,y2);
            iCount = 0;
            iSliceCount++;
        }
        else
        {
            objGraphics.DrawLine(new Pen(new SolidBrush(Color.Goldenrod)),
                        x1+iIndex,y1+5,x2+iIndex,y2-5);
        }
        iCount++;
    }
}

private void SetYAxis(ref Graphics objGraphics,float iSlices)
{
    int x1 = 95;
    int y1 = Height - 110;
    int x2 = 105;
    int y2 = Height - 110;
    int iCount = 1;
    int iSliceCount = 1;

    for(int iIndex = 0;iIndex < Height - 200;iIndex+=10)
    {
        if(iCount == 5)
        {
            objGraphics.DrawLine(new Pen(new SolidBrush(Color.Black)),
                x1 - 5, y1 - iIndex,x2 + 5,y2 - iIndex);
            objGraphics.DrawString(Convert.ToString(iSlices * iSliceCount),
                new Font("verdana",8),new SolidBrush(Color.White),
                60,y1 - iIndex );
            iCount = 0;
            iSliceCount++;
        }
        else
        {
            objGraphics.DrawLine(new Pen(new SolidBrush(Color.Goldenrod)),
                x1, (y1 - iIndex),x2,(y2 - iIndex));
        }
        iCount ++;
    }
}
This function plots the points (x,y) in the graph.
private void SetPixels(ref Graphics objGraphics)
{
float X1 = float.Parse(XAxis[0].ToString());
float Y1 = float.Parse(YAxis[0].ToString());
if(XAxis.Count == YAxis.Count)
{
for(int iXaxis = 0,iYaxis =0;(iXaxis < XAxis.Count - 1
&& iYaxis < YAxis.Count - 1);iXaxis++,iYaxis++)
{
PlotGraph(ref objGraphics,X1,Y1,
float.Parse(XAxis[iXaxis + 1].ToString()),
float.Parse(YAxis[iYaxis + 1].ToString()));
X1 = float.Parse(XAxis[iXaxis + 1].ToString());
Y1 = float.Parse(YAxis[iYaxis + 1].ToString());
}
}
else
{
}
}
This function sets the text for both X and Y axis.
private void SetAxisText(ref Graphics objGraphics)
{
    objGraphics.DrawString(XAxisText,new Font("Courier New",10),
        new SolidBrush(Color.LimeGreen),
        Width / 2 - 50,Height - 50);

    int X = 30;
    int Y = (Height / 2 ) - 50;
    for(int iIndex = 0;iIndex < YAxisText.Length;iIndex++)
    {
        objGraphics.DrawString(YAxisText[iIndex].ToString(),
            new Font("Courier New",10),new SolidBrush(Color.LimeGreen),
            X,Y);
        Y += 10;
    }
}
This function is used to set the Title text for the graph.
private void CreateTitle(ref Graphics objGraphics)
{
    objGraphics.FillRectangle(new SolidBrush(TitleBackColor),
               Height - 100,20,Height - 200,20);
    Rectangle rect = new Rectangle(Height - 100,20,Height - 200,20);
    objGraphics.DrawString(Title,new Font("Verdana",10),
               new SolidBrush(TitleForeColor),rect);
}
Code for the Webform1.aspx.cs
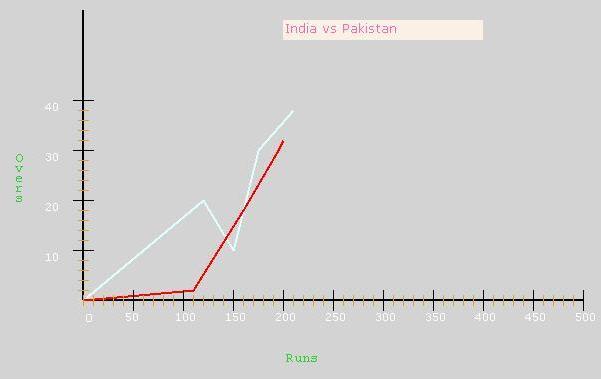
The code for the class file is over and now we need to create an instance of this file in a Web Form which needs line graph, and set appropriate properties. Here I'm using Score Comparison report as an example (India Vs. Pakistan) to draw a line graph to compare the runs scored by both teams using line graph.
Line2D line2d = new Line2D();
line2d.Height = 400;
line2d.Width = 700;
line2d.XSlice = 50;
line2d.YSlice = 10;
line2d.XAxisText = "Runs";
line2d.YAxisText = "Overs"
line2d.Title = "India vs Pakistan";
line2d.TitleBackColor = Color.Linen;
line2d.TitleForeColor = Color.HotPink;
line2d.InitializeGraph();
ArrayList arX = new ArrayList();
ArrayList arY = new ArrayList();
arX.Add(0);arX.Add(120);arX.Add(150);arX.Add(175);arX.Add(210);
arY.Add(0);arY.Add(100);arY.Add(50);arY.Add(150);arY.Add(190);
line2d.XAxis = arX;
line2d.YAxis = arY;
line2d.CreateGraph(Color.LightCyan);
arX = new ArrayList();
arY = new ArrayList();
arX.Add(0);arX.Add(110);arX.Add(160);arX.Add(195);arX.Add(200);
arY.Add(0);arY.Add(10);arY.Add(90);arY.Add(150);arY.Add(160);
line2d.XAxis = arX;
line2d.YAxis = arY;
line2d.CreateGraph(Color.Red);
Bitmap bmp = line2d.GetGraph();
bmp.Save(Response.OutputStream,ImageFormat.Jpeg);
This member has not yet provided a Biography. Assume it's interesting and varied, and probably something to do with programming.


 General
  News
News  Suggestion
  Question
  Bug
Bug  Answer
  Joke
Joke  Praise
  Rant
Rant  Admin
Admin 


