Introduction
C# provides rich features for building your own reusable controls. As we all know, third party controls are often expensive and don't have exactly the functionality we need, so we have to write extra code just to achieve some special functionality we might use over and over. Also we cannot tweak around the code of a third party component to change its behavior since we don't have the code.
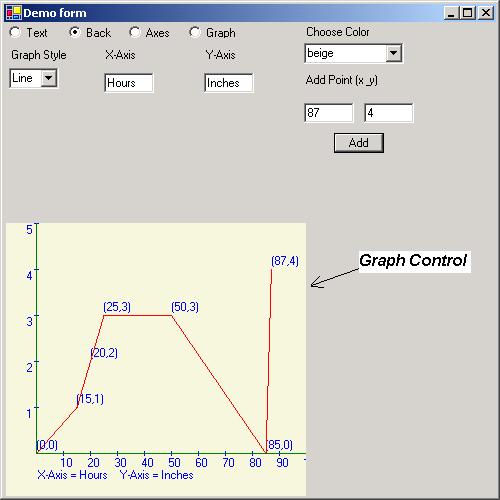
So here's a graph control that you might need to add to your application, which you can simply add to your forms, and in a matter of minutes you have a graph displayed on your form. Its as easy as adding a Button or TextBox to your form.
The graph control provides the following features:
- Graph style: Line graph or bar graph
- Graph colors: You can set colors for display text, axes and actual graph.
- Displaying points: You can choose to show the textual representation of a coordinate along with the graph.
- Scales: Have different scales for X axis and Y axis and choose their titles.
Using the code
As you can see the the picture above, I have a demo form with the graph control and I have added other controls to this form to add/modify the features of the graph control at run time.
Let's walk through the building of GraphControl to understand how a user control is built.
Lets get started....
The GraphControl is defined like this :
namespace UserControls
{
    public class GraphControl : System.Windows.Forms.UserControl
    {
     .......
We create a namespace UserControls and create a class GraphControl which is derived from UserControl, which defines it as a user control.
Structures and enumerations
Before we delve further into details of the GraphControl, let me define other structures and enumerations defined in the UserControls namespace
GraphStruct
public struct GraphStruct
{
    public int PointsOnXAxis,PointsOnYAxis;
    public float StartValueXAxis,StartValueYAxis;
    public int StepXAxis,StepYAxis;
    ...
    ..
}
The above structure is used to initialize the graph and will determine how the axes are drawn and how the co-ordinates are laid out.
PointsOnXAxis and PointsOnYAxis
These variables will define, the number of points to lay out on the axes. For e.g. if x-axis is representing number of years in an engineering course and y-axis represents the percentage/grade of the student in every year, then PointsOnXAxis will be 4 and PointsOnYAxis will be 10.
StartValueXAxis and StartValueYAxis
These variables define what the first value on X-Axis and Y-Axis should be. Using the example above, the x-axis will start with 1994 if the course started in 1994 and y-axis starts with 10 since grades will range from 10% to 100%.
StepXAxis and StepYAxis
These variables will define the increments for co-ordinates on each axis. Again, using the example above, the steps on x-axis will be 1 since we increment from year to year, whereas increments on y-axis will be 10 since we increment in steps of 10.
The graph for this example looks like:

FloatPoint
public struct FloatPoint
{
    public float X,Y,Value;
    ..
    .
}
This structure is used to represent a point on our graph. The reason why the class Point is inadequate for storing our points is because our co-ordinates are in float whereas Point takes integers only. Moreover, we also have an extra member called Value which is used to represent the actual display value.
For e.g. we want to display a point (1994,75) on the graph.
- This point is split into two specific points on our graph (1994,0) on x-axis and (0,75) on y-axis.
- Now, 1994 or 57 are just display values. Their actual co-ordinates are calculated by a function in our class called
FinLocationOnGraph which acts like the Windows' ScreenToClient function. So these points become float points with values like:
X = 134 ,Y = 561, Value = 1994 = > represents (1994,0)
X = 97, Y = 351 , Value = 57 = > represents (0,57)
GraphType
public enum GraphType
{
    Line,
    Bar
}
The above enumeration is used to decide the style of the graph.BarGraph or LineGraph.
Functions
Now lets see how GraphControl is implemented ....
DrawAxes function
void DrawAxes(Graphics g)
{
RectangleF rect = Region.GetBounds(g);
float xOrigin = rect.Left + 20;
float yOrigin = rect.Bottom - 70;
origin = new FloatPoint(xOrigin,yOrigin);
xAxis = new FloatPoint(rect.Right - 20,origin.Y);
yAxis = new FloatPoint(origin.X ,rect.Top);
Pen axisPen = new Pen(axesColor);
g.DrawLine(axisPen,origin.X,origin.Y,xAxis.X,xAxis.Y);
g.DrawLine(axisPen,origin.X,origin.Y,yAxis.X,yAxis.Y);
axisPen.Dispose();
}
This method draws the axes. It does the following things:
- Gets the bounds of the drawing area of the control.
- Defines the point for origin which will be at (left, bottom) point of the control
- Defines x-axis which will run from (left, bottom) to (right, bottom)
- Defines y-axis which will run from (left, bottom) to (left, top)
DrawPoints function
void DrawPoints(Graphics g)
{
float xDiff = xAxis.X - origin.X;
float yDiff = origin.Y - yAxis.Y;
float xStep = xDiff/GRAPHSTRUCT.PointsOnXAxis;
float yStep = yDiff/GRAPHSTRUCT.PointsOnYAxis;
FloatPoint fpt = new FloatPoint(origin.X,origin.Y);
fpt.Value = 0;
graphPointsX.Add(fpt);
graphPointsY.Add(fpt);
Pen p = new Pen(textColor);
Brush b = new SolidBrush(textColor);
Font f = new Font(Font.FontFamily,Font.Size);
for(int i = 1; i<= GRAPHSTRUCT.PointsOnXAxis; i++)
{
float xAxisX = origin.X + (i * xStep);
float xAxisY = origin.Y;
g.DrawLine(p,xAxisX,xAxisY - 2,xAxisX,xAxisY + 2);
float val = GRAPHSTRUCT.StartValueXAxis +
((i-1) * GRAPHSTRUCT.StepXAxis) ;
g.DrawString(val.ToString(),f,b,xAxisX-5,xAxisY + 3);
fpt.X = xAxisX;
fpt.Y = 0;
fpt.Value = val;
graphPointsX.Add(fpt);
}
for(int j = 1; j<= GRAPHSTRUCT.PointsOnYAxis; j++)
{
float yAxisX = origin.X;
float yAxisY = origin.Y - (j * yStep);
g.DrawLine(p,yAxisX -2 ,yAxisY,yAxisX + 2,yAxisY);
float val = GRAPHSTRUCT.StartValueYAxis +
((j-1) * GRAPHSTRUCT.StepYAxis) ;
g.DrawString(val.ToString(),f,b,yAxisX-15,yAxisY);
fpt.X = 0;
fpt.Y = yAxisY;
fpt.Value = val;
graphPointsY.Add(fpt);
}
f.Dispose();
b.Dispose();
p.Dispose();
}
This function draws the co-ordinates on the X and Y axes.
For X-axis:
- Calculates the diff
xDiff between origin and last co-ordinate of X-axis
- Calculates
xStep which is Points/Co-ordinates ratio. This will be the distance between every co-ordinate drawn on the X-axis.
- A small line and value of the co-ordinate will be drawn at each co-ordinate on X-axis.
- All these points will be saved in a list
graphPointsX
A similar procedure will be followed for Y-axis and the points will be stored in graphPointsY.
FindLocationOnGraph function.
FloatPoint FindLocationOnGraph(Point pt)
{
float diffX,diffY,diffValue,finalXValue,finalYValue;
diffX = diffY = -1;
finalXValue = finalYValue = 0;
for(int i=0;i < graphPointsX.Count;i++)
{
FloatPoint current = (FloatPoint)graphPointsX[i];
if((float)pt.X < current.Value)
{
FloatPoint previous = (FloatPoint)graphPointsX[i-1];
diffX = current.X - previous.X;
diffValue = current.Value - previous.Value;
float unitsPerCoordinate = diffValue/diffX;
finalXValue =
((pt.X - previous.Value)/unitsPerCoordinate)
+ previous.X;
break;
}
else if((float)pt.X == current.Value)
{
finalXValue = current.X;
}
}
for(int j=0;j < graphPointsY.Count;j++)
{
FloatPoint current = (FloatPoint)graphPointsY[j];
if((float)pt.Y < current.Value)
{
FloatPoint previous = (FloatPoint)graphPointsY[j-1];
diffY = current.Y - previous.Y;
diffValue = current.Value - previous.Value;
float unitsPerCoordinate = diffValue/diffY;
finalYValue =
((pt.Y - previous.Value)/unitsPerCoordinate)
+ previous.Y;
break;
}
else if((float)pt.Y == current.Value)
{
finalYValue = current.Y;
}
}
FloatPoint fpNew = new FloatPoint(finalXValue,finalYValue);
return fpNew;
}
This function will return the actual co-ordinates of a point like (1996,66) by converting it into floating point co-ordinates that the graph control can understand.
The code may seem difficult to understand but its really simple. Here is how it works..
Lets assume the following things:
- The origin (0,0) is located at location (45,45) on the graph.
- The point (0,60) is located at (45,100) on Y-axis.
- The point (0,70) is located at (45,150) on Y-axis.
So to find the exact location of (1999,66) on Y-axis we do the following:
- Find a point on Y axis greater than 66 .i.e. 70.
- Find the previous point which was lesser than 66. i.e. 60.
- Calculate difference between co-ordinates of these points
diffY. i.e. 150 -100 = 50.
- Calculate difference between the two values
diffValue i.e. 70 - 60 = 10.
- Calculate
unitsPerCoordinate=diffValue/diffY i.e. 10/50 = 0.2.
- Calculate difference between the lesser value and our
Points value. i.e. 66-60 = 6.
- This means the our point 66 is (6 / 0.2)
graphPoints ahead of 60.
- So
finalYValue of 66 will be equal to location of 60 + (6 / 0.2) i.e. 100 + 30 = 130.
- The point (0,66) will be positioned on Y-axis as (45,130).
- Similarly we find the X-axis position (1996, 0).
- We then create a new
FloatPoint with finalXValue and finalYValue
DrawLineGraph function
void DrawLineGraph(Graphics g)
{
Pen p = new Pen(graphColor);
Point start = (Point)Points[0];
FloatPoint prev,current;
prev = FindLocationOnGraph(start);
for(int i=1 ; i < Points.Count ;i++)
{
Point pt = (Point)Points[i];
current = FindLocationOnGraph(pt);
g.DrawLine(p,prev.X,prev.Y,current.X,current.Y);
if(bShowPoints)
{
Brush b = new SolidBrush(textColor);
Font f = new Font(Font.FontFamily,Font.Size);
string title = "(" + pt.X + "," + pt.Y + ")";
if(prev.Y > current.Y)
g.DrawString(title,f,b,current.X - 25,
current.Y - 15);
else
g.DrawString(title,f,b,
current.X - 25, current.Y + 5);
if(i ==1)
{
title = "(" + start.X + "," + start.Y + ")";
g.DrawString(title,f,b,prev.X - 10, prev.Y - 15);
}
f.Dispose();
b.Dispose();
}
prev = current;
}
p.Dispose();
}
This function draws the line graph. Its pretty simple. This is what it does ..
- Get the first
Point from the the Points list.
- Find its location by passing it to
FindLocationOnGraph
- Store this in
FloatPoint prev
- Get the next point and repeat step 2 for it and store it in
FloatPoint current.
- Draw a line from
prev to current
- If the property
ShowPointsOnGraph is true then paint the co-ordinates.
- If the line being drawn is sloping downwards then draw the co-ordinates above the line else below it.
- Store the
current point into prev
- Repeat step 4 to 7 till you have drawn every point in the list.
OnPaint function
protected override void OnPaint(PaintEventArgs pe)
{
Rectangle bound = new Rectangle(new Point(0,0),Size);
graphRegion = new Region(bound);
Region = graphRegion;
DrawAxes(pe.Graphics);
DrawPoints(pe.Graphics);
DrawTitles(pe.Graphics);
if(graphType == GraphType.Bar)
DrawBarGraph(pe.Graphics);
else
DrawLineGraph(pe.Graphics);
DrawAxes(pe.Graphics);
}
This is the most important function if you are building your own user control. Override this function to paint your control. This is where the real action happens:
- Step 1. We first set the bounds of our drawing area by the size of the control.
- Step 2. Then we use the bounds to define the
graphRegion, where the graph will be drawn.
- Step 3. Then we draw the axes.
- Step 4. Then draw the points on the axes.
- Step 5. Then draw the titles for the axes.
- Step 6. And depending on the
GraphStyle property, we draw the graph.
- Step 7. We redraw the axes because some points may lie on the axis and may draw over it.
There you have it! 7 easy steps to build the GraphControl!!
Running the code
I wrote this code using SharpDevelop. You can just compile the DemoForm.cs at command prompt if you don't use an IDE.
- Just compile and run the demo project and you can change the colors by choosing a radio button and then choosing a sample color from the combo-box.
- You can add new
Points by adding points using the text boxes and the button Add
- The sample program shows different overloaded methods for
AddPoints function.
- Comment the 1st line in
Main and uncomment the second line to see another graph demo.
- If you are writing your code and want to manipulate the behavior of
GraphControl at run time, do not forget to call Invalidate function of the control. This function forces the control to redraw itself.
Finally, I have provided the demowithclass.bat and demowithdll.bat files along with the code. The first one uses the graphcontrol.cs file along with the demo form. And the second one builds a graph.dll and the demo form loads the control from the DLL.
I have an experience of 5 years in software and it was mostly VC++ COM/DCOM. I recently took up studying C# and found it very easy and interesting.I got my MCAD in C# in Feb 2003 and used the articles on this site to leanr new things and expand my C# knowledge. I love this site and I want to post articles to help others learn C# easily and quickly.
When I am not programming, I listen to lots of music, watch lots of movies, read lots of non-computer books and am a self-improvement junkie.
I believe in doing whatever it takes to achive one's goals and you would rather be busy DOING things to make you succussful than sitting on the couch cribbing about how life is unfair!


 General
  News
News  Suggestion
  Question
  Bug
Bug  Answer
  Joke
Joke  Praise
  Rant
Rant  Admin
Admin 


