Introduction
Why would anyone want to display data in a histogram control (or a bar chart control)? Well, imagine that you have a list of values that you want to display to the user. How can you do that? A solution might be loading all of those data into a list box control and displaying them like that to the user. However, by doing so, the user will not immediately see at which index the highest value is, or the lowest. The user might be forced to look at all of those values in order to find what he was looking for.
One solution to the problem above is displaying all of the data in a control that has a meaningful representation for the user, like a bar chart (or a histogram). A bar chart will display all of the data in a graphical manner allowing the user to look at the image and determine the highest value (or the lowest one).
A real situation where this control might be useful is when you want to present a user with a histogram of colors for an image. The demo does just that, and a screenshot is presented below:
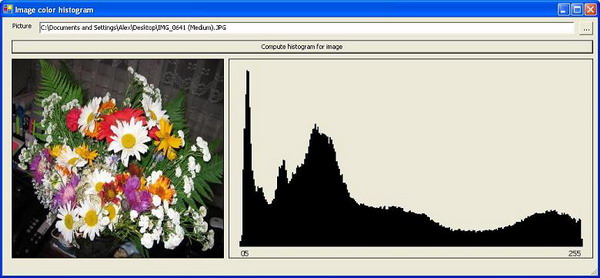
The histogram control
Let's go in more detail, shall we? The histogram control is implemented as a user control enabling users to drag and drop it on the form. The Paint event of the control was modified in order to draw the histogram on the screen.
Displaying the data is as simple as calling the DrawHistogram method, that takes in an array of numbers:
public void DrawHistogram(long[] Values)
{
    myValues = new long[Values.Length];
    Values.CopyTo(myValues,0);

    myMaxValue = getMaxim(myValues);
    myIsDrawing = true;

    ComputeXYUnitValues();
    this.Refresh();
}
What this code does? Well, it copies the array into an internal array (for further use). Then it determines the maximum value in that array. It does this in order to compute a scaling number, which I will present shortly. And finally, it will compute the scaling units for both the vertical and the horizontal axes.
The line of code this.Refresh(); is used to instruct the user control to force a redraw of itself and to display the data.
Scaling the data
Because we need to be able to display a value of, let's say 10000 on a 100 pixel height area, we need to scale the input data. This is in done in the ComputeXYUnitValues function. The scaling is done both on the X and on the Y axis.
- On the X axis: We want to have bars for each value of the same width. In order to determine the optimal width for each bar, we divide the width of the control by the number of objects. The resulting number is the XUnit and we use this unit to draw the bars on the control.
- On the Y axis: We have to scale the objects, as I have said earlier. To determine the factor by which to scale, we divide the height of the control by the greatest number we must display. The resulting number, YUnit, will be multiplied with each value that must be displayed. By doing so, we ensure that the tallest bar will fit into the drawing area. (If you remember some math, this can be thought of as normalizing values.)
The code that calculates the XUnit and YUnit values are presented below:
private void ComputeXYUnitValues()
{
  myYUnit = (float) (this.Height - (2 * myOffset)) / myMaxValue;
  myXUnit = (float) (this.Width - (2 * myOffset)) / (myValues.Length-1);
}
This function will also be called when a resize event occurs. We do this because, when we resize the control, these values change.
Drawing the data on the control
After we know the values with which we scale the bars, it is time to actually draw them on the screen. If you don’t know much about drawing with GDI+, I recommend you this sample book chapter from CodeProject: Professional C# - Graphics with GDI+.
Let's get into it. The drawing method looks like this. I will guide you through the code:
if (myIsDrawing)
{
Graphics g = e.Graphics;
Pen myPen = new Pen(new SolidBrush(myColor),myXUnit);
for (int i=0;i<myValues.Length;i++)
{
g.DrawLine(myPen,new PointF(myOffset + (i*myXUnit),
this.Height - myOffset),new PointF(myOffset + (i*myXUnit),
this.Height - myOffset - myValues[i] * myYUnit));
if (myValues[i]==myMaxValue)
{
SizeF mySize = g.MeasureString(i.ToString(),myFont);
g.DrawString(i.ToString(),myFont,
new SolidBrush(myColor),
new PointF(myOffset + (i*myXUnit) - (mySize.Width/2),
this.Height - myFont.Height),
System.Drawing.StringFormat.GenericDefault);
}
}
g.DrawString("0",myFont, new SolidBrush(myColor),
new PointF(myOffset,this.Height - myFont.Height),
System.Drawing.StringFormat.GenericDefault);
g.DrawString((myValues.Length-1).ToString(),myFont,
new SolidBrush(myColor),
new PointF(myOffset + (myValues.Length * myXUnit)
- g.MeasureString((myValues.Length-1).ToString(),myFont).Width,
this.Height - myFont.Height),
System.Drawing.StringFormat.GenericDefault);
g.DrawRectangle(new System.Drawing.Pen(new SolidBrush(Color.Black),1),0,0,
this.Width-1,this.Height-1);
}
First of all, we determine if we are in the drawing mode. This mode is set by the DrawHistogram method and it means that we have the data to draw.
I then create a pen with which I will draw the bars on the screen. Notice that the width of the pen is the XUnit computed before.
For each value in the input array, I draw a line, with the height specified by multiplying the value itself with the scaling unit YUnit. The code that does this is a bit complicated. If you don't figure it out, please let me know. Basically, I am measuring the height of the bar, and determining the points between where to draw the line. I must draw the line starting with the lower part of the control.
Then, I check to see if the value is the maximum value. If so, I will draw a string, corresponding to the index of the value below that value. I do this in order to show where the maximum value is. Of course, this behavior could have been duplicated for the minimum value as well.
After we draw all of the bars, we draw the legend of the histogram. This is formed by 0 and the length of the array of values. I also draw a rectangle to give the impression of a border surrounding the control.
As you can see, the code that draws the histogram is pretty simple.
A demo application
As I have said in the beginning, one might use this application in order to display a histogram of the colors in the picture. Let's see how this can be done. The code for this application is available for download.
Computing the histogram of colors
Computing the histogram of colors is also simple. A color representation in a computer is basically made up of three elements (called channels):
- The quantity of red in that color (R).
- The quantity of green in that color (G).
- The quantity of blue in that color (B).
A color of (R=0, G=0, B=0) is black and (R=255, G=255, B=255) is white. If each of this quantity uses 8 bits to display, together, these three elements will give a total of 16.581.375 colors.
To compute a histogram, we can only choose to display for a single channel, an average for 2 channels, or an average for 3 channels. I have chosen the latter approach. By averaging the values for each channel, I will always get a value between 0 and 255. This value represents the gray representation for that color.
So, what we have to do is to get the color of each pixel in the image, to average it, and to add it to the appropriate bin of the array, like so:
public long[] GetHistogram(System.Drawing.Bitmap picture)
{
 long[] myHistogram = new long[256];

 for (int i=0;i<picture.Size.Width;i++)
  for (int j=0;j<picture.Size.Height;j++)
  {
   System.Drawing.Color c  = picture.GetPixel(i,j);

   long Temp=0;
   Temp+=c.R;
   Temp+=c.G;
   Temp+=c.B;

   Temp = (int) Temp/3;
   myHistogram[Temp]++;
  }

 return myHistogram;
}
All we need is a Bitmap representation of our picture.
Displaying the histogram
After we have the array that shows us the histogram of colors, we must display it in the control, like so:
Histogram.DrawHistogram(myValues);
And this is all you need to do!
Conclusion
This article was intended to show you how you can create your own control that displays data. Hope you have learned something from this. Now, you have a histogram control you can use!
I am open for questions!
Happy coding!
I am working on the C# compiler at Microsoft since 2007.
Microsoft Certified Professional since 2006
Interests: C#, ASP.NET, LINQ


 General
  News
News  Suggestion
  Question
  Bug
Bug  Answer
  Joke
Joke  Praise
  Rant
Rant  Admin
Admin 


 )
)