
Introduction
Graphics within the .NET Framework is a powerful feature that can be adapted to a wide range of purposes. Here I have developed a class to demonstrate the use of graphics to create graphs like:
- Bar graph
- Pie graph
- Line graph
Using the Code
The attached project contains a file named DrawGraph.cs, which is the generic library to generate graphs. The methods in this library generate graphs like the Single dimension Bar graph, 3D Bar graph, Single dimension Pie graph, 3D Pie graph and Line graph. All the graphs are generated in bitmap format. The code below demonstrates the use of this library in a Windows application:
string [] keyValue=new string[ui_lbx_DataKey.Items.Count];
float[] values = new float[ui_lbx_DataKey.Items.Count];
for (int i = 0; i < ui_lbx_DataKey.Items.Count; i++)
{
keyValue[i] = ui_lbx_DataKey.Items[i].ToString();
values[i] = float.Parse(ui_lbx_DataValue.Items[i].ToString());
}
DrawGraph bargraph = new DrawGraph(keyValue, values,
ui_txt_xlabel.Text, ui_txt_ylabel.Text,
"Courier", 255);
p1.Image = bargraph.DrawBarGraph();
p2.Image = bargraph.Draw3dBarGraph();
p3.Image = bargraph.DrawPieGraph();
p4.Image = bargraph.Draw3DPieGraph();
DrawGraph bargraph1 = new DrawGraph(keyValue, values,
ui_txt_xlabel.Text, ui_txt_ylabel.Text,
"Courier", 255);
p5.Image = bargraph1.DrawLineGraph();
The code below demonstrates the use of this library in an ASP.NET application:
DrawGraph bargraph = new DrawGraph(keyValue, values,
"Financial Year","Profit", "Courier", 255);
System.Drawing.Bitmap b = new System.Drawing.Bitmap(400, 400);
b = bargraph.DrawLineGraph();
b.Save(Server.MapPath("Graph")+"\\LineGraph.bmp");
Image1.ImageUrl =".\\Graph\\LineGraph.bmp";
System.Drawing.Bitmap b1 = new System.Drawing.Bitmap(400, 400);
b1 = bargraph.DrawPieGraph();
b1.Save(Server.MapPath("Graph") + "\\PieGraph.bmp");
Image2.ImageUrl = ".\\Graph\\PieGraph.bmp";
System.Drawing.Bitmap b2 = new System.Drawing.Bitmap(400, 400);
b2 = bargraph.Draw3DPieGraph();
b2.Save(Server.MapPath("Graph") + "\\3DPieGraph.bmp");
Image3.ImageUrl = ".\\Graph\\3DPieGraph.bmp";
System.Drawing.Bitmap b3 = new System.Drawing.Bitmap(400, 400);
b3 = bargraph.Draw3dBarGraph();
b3.Save(Server.MapPath("Graph") + "\\3dBarGraph.bmp");
Image4.ImageUrl = ".\\Graph\\3dBarGraph.bmp";
Code
There are a few imports made at the start of the class. Those imports are included to work with image files.
using System;
using System.Collections.Generic;
using System.Text;
using System.Drawing.Imaging;
using System.Drawing.Drawing2D;
using System.Drawing;
Now come the global variables:
string[] valueLabels; float[] values;
string xLabel;
string yLabel;
string fontFormat;
int alpha;
List <color> colorList;
These global variables are being initialized using the constructor:
public DrawGraph(string[] valueLabels,float[] values,string xLabel,string
                               yLabel,string fontFormat,int alpha)
{
  this.valueLabels = valueLabels;
  this.values = values;
  this.xLabel = xLabel;
  this.yLabel = yLabel;
  this.alpha = alpha;
  this.fontFormat=fontFormat;
  InitColorList();
}
Here InitColorList() is a method to initialize colorList with dark colors.
private void InitColorList()
{
colorList = new List<color />();
foreach (string colorName in Enum.GetNames(typeof(System.Drawing.KnownColor)))
{
if (colorName.StartsWith("D") == true)
{
colorList.Add(System.Drawing.Color.FromName(colorName));
}
}
}
In this class we have some more private methods like EmbedAxis(), EmbedXPanel() and EmbedXLinePanel(). These are used to create axes, create x-axis value mapping with color and create x-axis value mapping to line color respectively.
Bitmap EmbedAxis(Bitmap graph,bool showAxis)
{
Bitmap backgroundCanvas = new Bitmap(400, 300);
Bitmap yLabelImage = new Bitmap(15,200);
Graphics graphicsBackImage = Graphics.FromImage(backgroundCanvas);
Graphics objGraphic2 = Graphics.FromImage(graph);
Graphics objGraphicY = Graphics.FromImage(yLabelImage);
Pen blackPen = new Pen(Color.Black, 2);
whiteBrush = new SolidBrush(Color.White);
graphicsBackImage.FillRectangle(whiteBrush,0, 0, 400, 300);
if (showAxis == true)
{
StringFormat sf = new StringFormat(StringFormatFlags.DirectionVertical);
Font f = new Font(fontFormat,8);
SizeF sizef = objGraphicY.MeasureString("<- " + yLabel, f, Int32.MaxValue,sf);
RectangleF rf = new RectangleF(0, 0, sizef.Width, sizef.Height);
objGraphicY.DrawRectangle(Pens.Transparent,rf.Left, rf.Top, rf.Width, rf.Height);
objGraphicY.DrawString((yLabel.Length>0?"<-":"") + yLabel,
f, Brushes.Black, rf, sf);
graphicsBackImage.DrawString(xLabel +(xLabel.Length>0?" ->":""),
f, Brushes.Black, 30, 235);
graphicsBackImage.DrawLine(blackPen,new Point(0, 230), new Point(230, 230));
graphicsBackImage.DrawLine(blackPen, new Point(20, 20), new Point(20, 250));
}
graphicsBackImage.DrawImage(graph, 25, 25);
if (showAxis == true)
{
graphicsBackImage.DrawImage(yLabelImage, 0, 90);
}
return (backgroundCanvas);
}
Bitmap EmbedXPanel(Bitmap graph)
{
Bitmap xPanel = new Bitmap(100, 200);
Graphics objGraphicPanel = Graphics.FromImage(xPanel);
Graphics graphicGraph = Graphics.FromImage(graph);
for (int i = 0, x = 10; i <values.Length; i++)
{
SolidBrush brush = new SolidBrush(Color.FromArgb(alpha,colorList[i]));
objGraphicPanel.FillRectangle(brush, 10, 190 - x, 10, 10);
string drawString = valueLabels[i] + " = " + values[i].ToString();
Font drawFont = new Font(fontFormat, 8);
SolidBrush drawBrush = new SolidBrush(Color.Black);
objGraphicPanel.DrawString(drawString,drawFont, drawBrush, 20, 190 - x);
x += 20;
}
graphicGraph.DrawImage(xPanel,300, 25); return (graph);
}
Bitmap EmbedXLinePanel(Bitmap graph)
{
Bitmap xPanel = new Bitmap(100, 200);
Graphics objGraphicPanel = Graphics.FromImage(xPanel);
Graphics graphicGraph = Graphics.FromImage(graph);
for (int i = 1, x = 10; i < values.Length; i++)
{
SolidBrush brush = new SolidBrush(Color.FromArgb(alpha,colorList[i]));
Pen colorPen = new Pen(brush,2);
objGraphicPanel.DrawLine(colorPen,10, 190 - x, 20, 190 - x);
string drawString = valueLabels[i - 1].ToString() + " - " + valueLabels[i].ToString();
Font drawFont = new Font(fontFormat, 8);
SolidBrush drawBrush = new SolidBrush(Color.Black);
objGraphicPanel.DrawString(drawString, drawFont, drawBrush, 20, 190 - x);
x += 20;
}
graphicGraph.DrawImage(xPanel,300, 25);
return (graph);
}
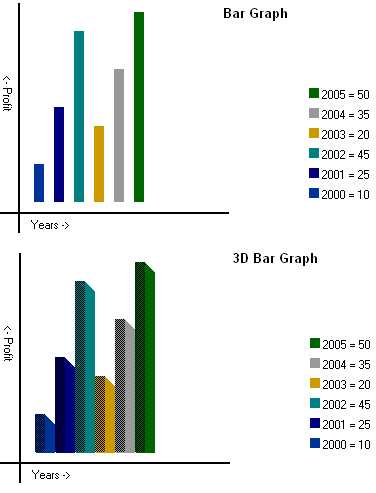
Let's check out the method to create a Bar graph. Here this method follows a simple algorithm:
- First prepare a white canvas of dimensions 200 X 200.
- Calculate the highest value [ x-axis values ].
- For each value on the x-axis...
- Calculate the bar height using the formula: bar height=(x Value / highest value) * 190.
- Draw the bar.
- Draw the axis and place the bar graph on an enlarged canvas using
EmbedAxis(). - Draw the x-value mapping to the color using
EmbedXPanel().
public Bitmap DrawBarGraph()
{
Bitmap objgraph = new Bitmap(200, 200);
Graphics graphicGraph = Graphics.FromImage(objgraph);
SolidBrush whiteBrush = new SolidBrush(Color.White);
graphicGraph.FillRectangle(whiteBrush,0, 0, 200, 200);
float highestValue;
float[] tempValue = new float[values.Length];
for (int j = 0; j < values.Length; j++)
{
tempValue[j] = values[j]; } Array.Sort<float>(tempValue);
highestValue = tempValue[values.Length - 1];
for (int i = 0, x = 10; i < values.Length; i++)
{
float barHeight;
barHeight = (values[i] / highestValue) * 190;
SolidBrush brush = new SolidBrush(Color.FromArgb(alpha, colorList[i]));
graphicGraph.FillRectangle(brush,x, 194 - barHeight, 10, barHeight);
x += 20;
}
Increase the size of the canvas and draw axis
objgraph = EmbedAxis(objgraph, true);
objgraph = EmbedXPanel(objgraph);
return (objgraph);
}
Drawing a 3D Bar Graph is similar to the above code of bar graphs except that we need to perform some additional tasks like:
- Draw a shadow.
- Draw a white line at the bottom of the graph to hide the shadow.
public Bitmap Draw3dBarGraph()
{
Bitmap objgraph = new Bitmap(200, 200);
Bitmap objXValuePanel = new Bitmap(100,200);
Graphics graphicGraph = Graphics.FromImage(objgraph);
Graphics graphicXValuePanel = Graphics.FromImage(objXValuePanel);
SolidBrush whiteBrush = new SolidBrush(Color.White);
graphicGraph.FillRectangle(whiteBrush,0, 0, 200, 200);
float highestValue;
float[] tempValue = new float[values.Length];
for (int j = 0; j < values.Length; j++)
{
tempValue[j] = values[j];
}
Array.Sort<float>(tempValue);
highestValue = tempValue[values.Length - 1];
for (int i = 0, x = 10; i < values.Length; i++)
{
SolidBrush brush = new SolidBrush(Color.FromArgb(alpha,colorList[i]));
float barHeight;
barHeight = (values[i] / highestValue)* 190;
float shadex = x + 10; float shadey = 194 - ((int)barHeight) + 10;
for (int iLoop2 = 0; iLoop2 < 10; iLoop2++)
{
graphicGraph.FillRectangle(brush, shadex - iLoop2, shadey - iLoop2, 10, barHeight);
}
graphicGraph.FillRectangle(new HatchBrush(HatchStyle.Percent50, brush.Color),
x, 194 - barHeight, 10, barHeight);
x += 20;
}
Pen whitePen = new Pen(Color.White, 10);
graphicGraph.DrawLine(whitePen,new Point(10, 200), new Point(230, 200));
objgraph = EmbedAxis(objgraph, true);
objgraph = EmbedXPanel(objgraph);
return (objgraph);
}
To draw a Pie graph following the below algorithm:
- First prepare a white canvas of dimensions 200 X 200.
- Calculate the sum of all x-values [ x-axis values ].
- Initialize the start angle of the pie to 0 degrees.
- For each value...
- Calculate
sweepAngle using the formula: sweep angle= (x value * 360) / sum of all x values. - Draw the pie.
- Increase the start angle with the sweep angle.
- Place the pie graph on an enlarged the canvas using
EmbedAxis(), with showAxis flag set to false. - Draw the x-value mapping to the color using
EmbedXPanel().
public Bitmap DrawPieGraph()
{
Bitmap objgraph = new Bitmap(200, 200);
Graphics graphicGraph = Graphics.FromImage(objgraph);
int x = 0;
int y = 0;
int width = 200;
int height = 100;
angles. float sweepAngle = 0;
float startAngle = 0;
float total = 0;
for (int i = 0; i < values.Length; i++)
{
total += values[i];
}
for (int i = 0; i < values.Length; i++)
{
SolidBrush objBrush = new SolidBrush(colorList[i]);
sweepAngle = (values[i] * 360) / total;
graphicGraph.SmoothingMode = SmoothingMode.AntiAlias;
graphicGraph.FillPie(objBrush, x, y, width, height, startAngle, sweepAngle);
startAngle += sweepAngle; }
objgraph = EmbedAxis(objgraph, false);
objgraph = EmbedXPanel(objgraph); return (objgraph);
}
Drawing a 3D Pie is similar to a Pie graph with an additional task: drawing shadows.
Bitmap Draw3DPieGraph()
{
Bitmap objgraph = new Bitmap(200, 200);
Graphics graphicGraph = Graphics.FromImage(objgraph);
int x =0;
int y = 0;
int width = 200;
int height = 100;
total = 0; for (int i = 0; i < values.Length; i++)
{
total += values[i];
}
for (int loop = 0; loop < 2; loop++)
{
float sweepAngle = 0;
float startAngle = 0;
for (int i = 0; i < values.Length; i++)
{
SolidBrush objBrush = new SolidBrush(colorList[i]);
sweepAngle = (values[i] * 360) / total;
graphicGraph.SmoothingMode = SmoothingMode.AntiAlias;
if (loop == 0)
{
for (int iLoop2 = 0; iLoop2 < 10; iLoop2++)
graphicGraph.FillPie(new HatchBrush(HatchStyle.Percent50,objBrush.Color),
x, y + iLoop2, width, height, startAngle, sweepAngle);
}
else
{
graphicGraph.FillPie(objBrush, x, y, width, height, startAngle, sweepAngle);
}
startAngle += sweepAngle;
}
}
objgraph = EmbedAxis(objgraph, false);
color code objgraph = EmbedXPanel(objgraph);
return (objgraph);
}
To draw a Line graph, we use the same formula of bar graph to calculate the height. Once the points are marked, just join them using lines with different colors. x-Panel has to be drawn using EmbedXLinePanel().
public Bitmap DrawLineGraph()
{
Bitmap objgraph = new Bitmap(200, 200);
Graphics graphicGraph = Graphics.FromImage(objgraph);
SolidBrush whiteBrush = new SolidBrush(Color.White);
graphicGraph.FillRectangle(whiteBrush,0, 0, 200, 200);
int highestValue;
int[] tempValue = new int[values.Length];
for (int j = 0; j < values.Length;j++)
{
tempValue[j] = (int)values[j];
}
Array.Sort<int>(tempValue);
highestValue = tempValue[values.Length - 1];
int[,] points = new int[values.Length, 2];
for (int i = 0, x = 10; i < values.Length; i++)
{
decimal barHeight;
barHeight = (decimal)(values[i] / highestValue * 190);
points[i, 0] = x; barHeight = 194 - barHeight;
points[i, 1] = (int)Decimal.Round(barHeight,0);
Font f = new Font(fontFormat, 8);
graphicGraph.FillEllipse(Brushes.Black, points[i,0]-2, points[i, 1]-2, 5, 5);
graphicGraph.DrawString(values[i].ToString(), f,
Brushes.Black,new Point(points[i, 0]-14, points[i, 1]-5));
x += 20;
}
for (int i = 1; i < values.Length; i++)
{
Point startPoint = new Point(points[i - 1, 0], points[i - 1, 1]);
Point endPoint = new Point(points[i, 0], points[i, 1]);
SolidBrush brush = new SolidBrush(colorList[i]); Pen colorPen = new Pen(brush, 2);
graphicGraph.DrawLine(colorPen, startPoint, endPoint);
}
objgraph = EmbedAxis(objgraph,true);
objgraph = EmbedXLinePanel(objgraph);
return (objgraph);
}
History
- 27 February, 2008 -- Original version posted
- 27 March, 2008 -- Introduced Bar Line Graph
Anoop Unnikrishnan is associated with a CMM Level 5 Company. He has done his Bachelor of Engineering in Information Science. His certifications include OCA,IBM SOA Associate, MCAD, MCTS and MCPD. Currently persuing MBA.
He is working on .NET since first Beta versions. He has also published his book "Start Programming with C#".
Grab a copy from www.pothi.com/pothi/book/anoop-unnikrishnan-start-programming-c
Anoop can be reached : anoopukrish@gmail.com


 General
  News
News  Suggestion
  Question
  Bug
Bug  Answer
  Joke
Joke  Praise
  Rant
Rant  Admin
Admin 


